Fig. 3
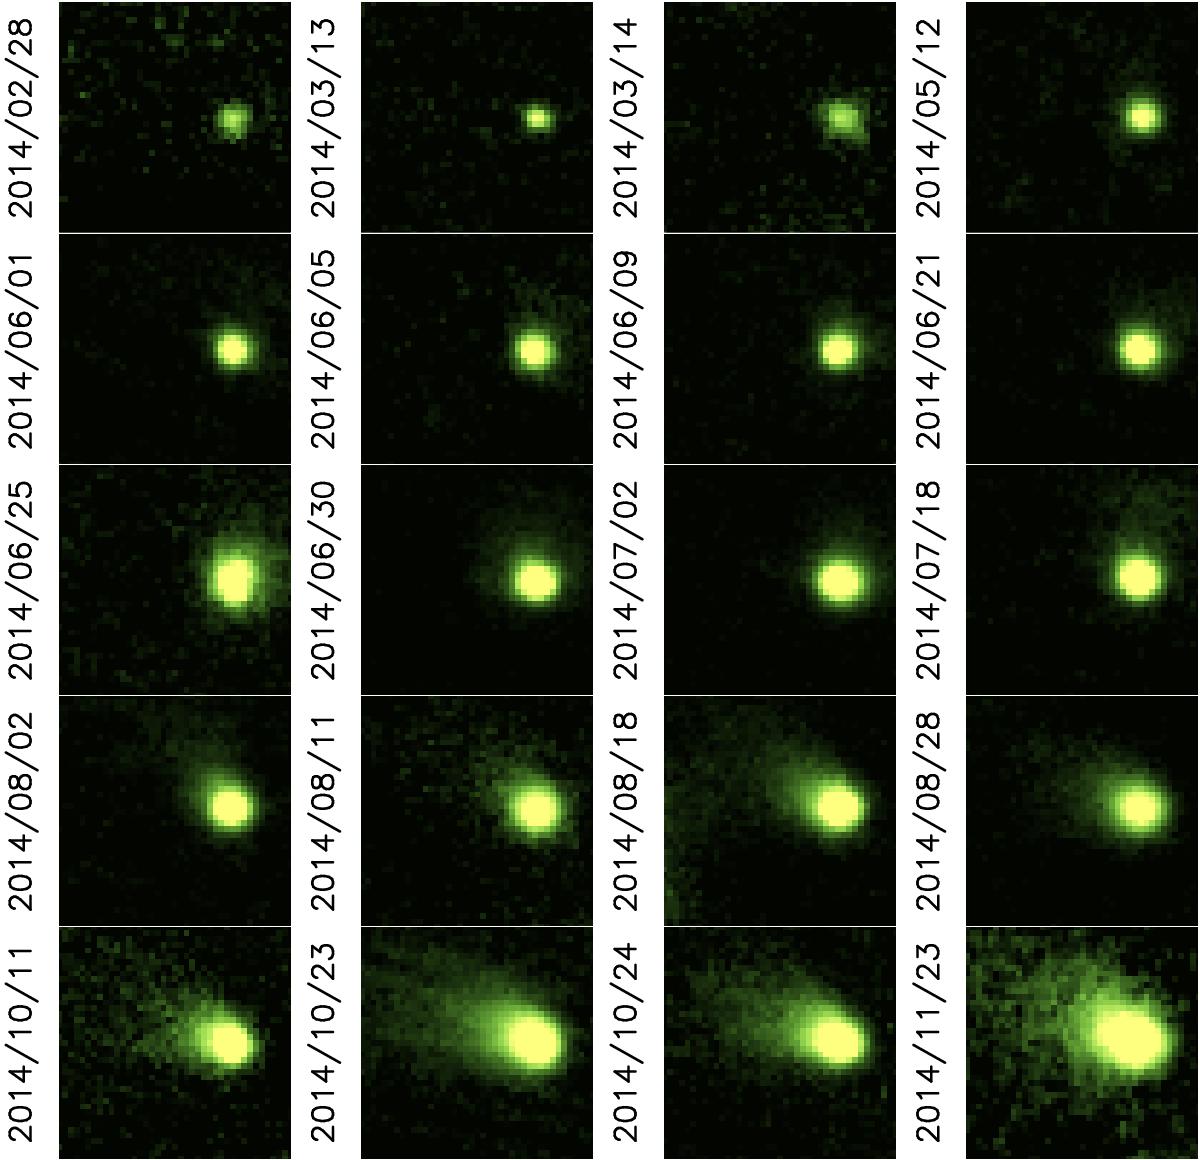
Subset of 20 out of the 52 VLT/FORS2 images taken between February and November 2014, with the R-SPECIAL filter. North is up, east to the left in all images. The date of observation is indicated in each panel. All the images have 40 × 40 pixels in size, which can be converted to physical size at the comet using the spatial resolution values of last column of Table A.1 (see Appendix A).
Current usage metrics show cumulative count of Article Views (full-text article views including HTML views, PDF and ePub downloads, according to the available data) and Abstracts Views on Vision4Press platform.
Data correspond to usage on the plateform after 2015. The current usage metrics is available 48-96 hours after online publication and is updated daily on week days.
Initial download of the metrics may take a while.