Fig. 7
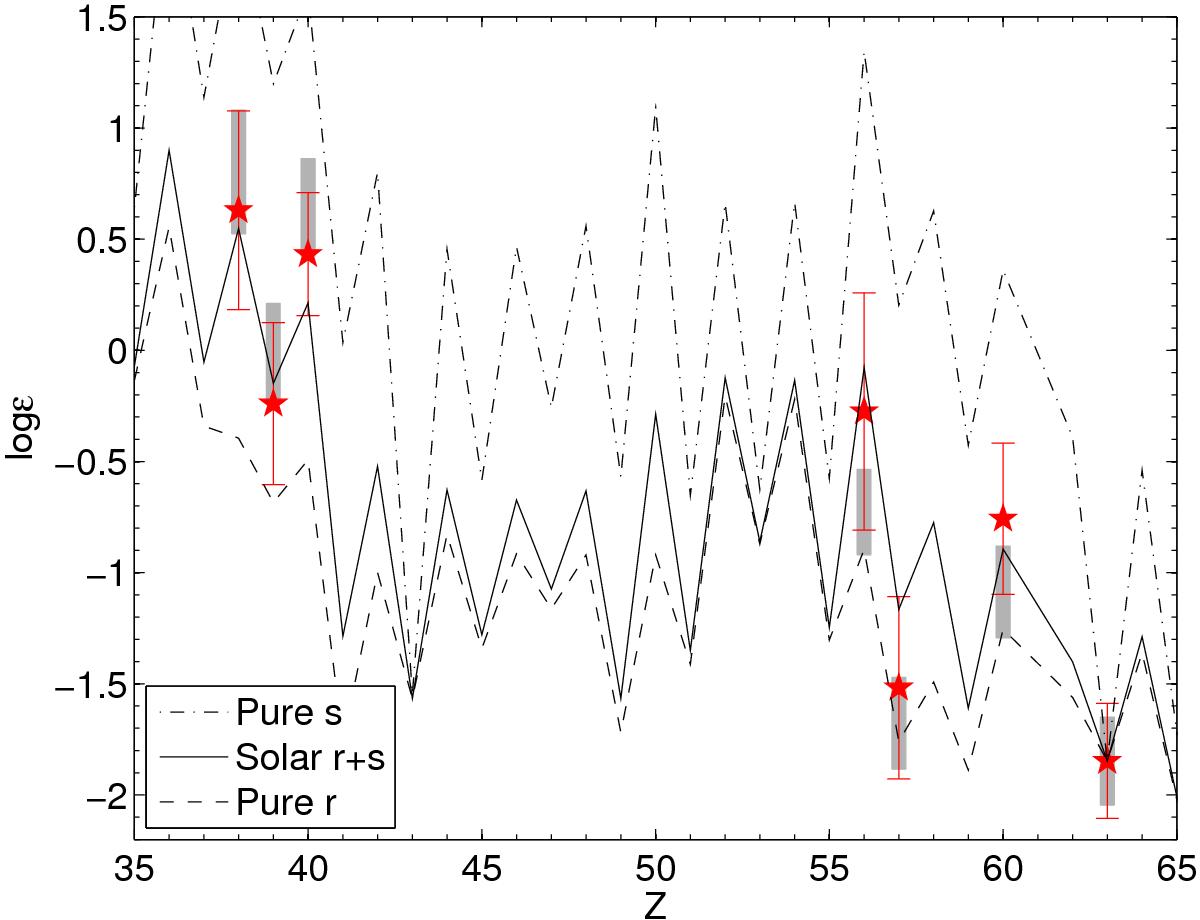
Mean neutron capture element abundances to the exclusion of the CH star, the CEMP-s star, and the metal-rich giant. The errorbars represent the star-to-star scatter. Also shown are the Solar r- and s-process contributions from Simmerer et al. (2004). Grey-shaded areas indicate the 1σ abundance ranges of the weak-r-process star HD 122563 from Honda et al. (2006). All curves were normalised to Eu.
Current usage metrics show cumulative count of Article Views (full-text article views including HTML views, PDF and ePub downloads, according to the available data) and Abstracts Views on Vision4Press platform.
Data correspond to usage on the plateform after 2015. The current usage metrics is available 48-96 hours after online publication and is updated daily on week days.
Initial download of the metrics may take a while.