Fig. 1
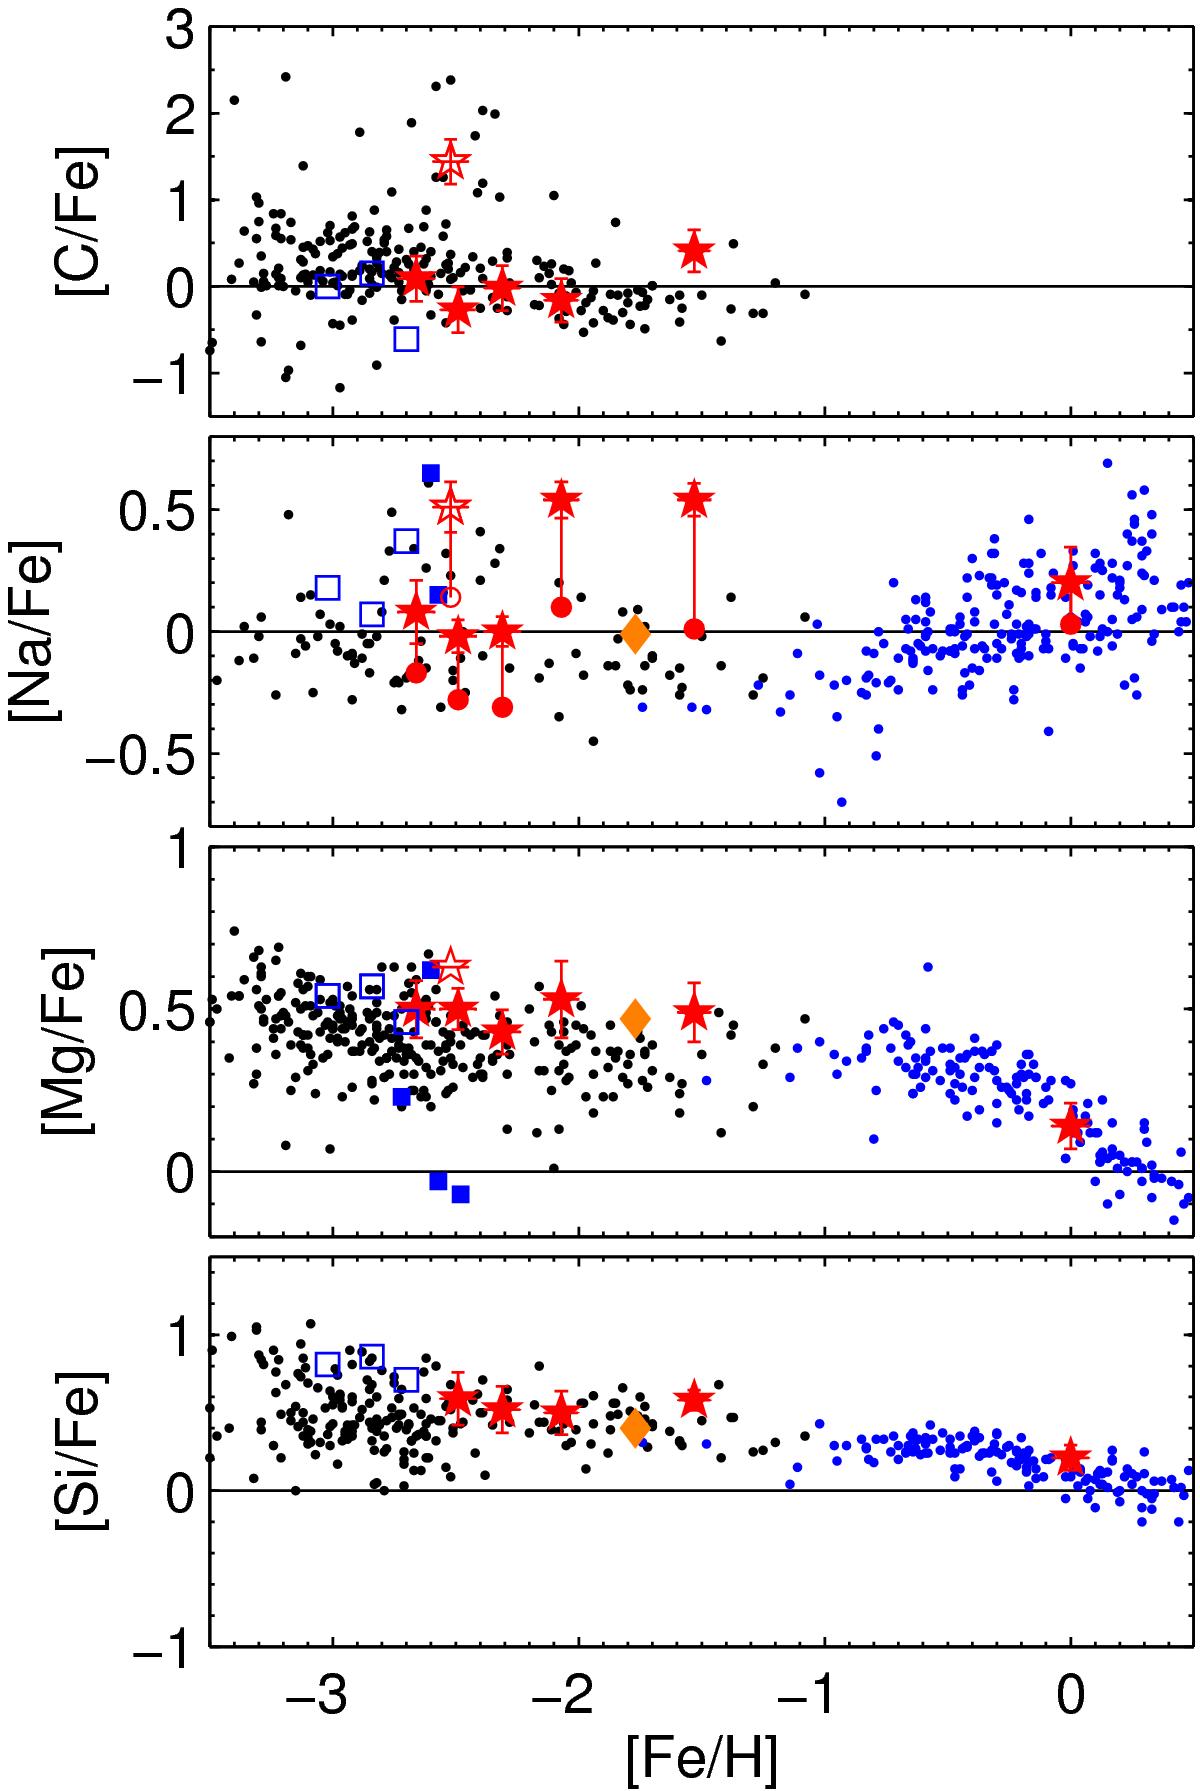
Abundance results for C, Na, Mg, and Si. Our results are shown as red star symbols, where the open star singles out the CEMP-s star 27793. For Na, NLTE abundances are also shown by red circles. Error bars account for random and systematic uncertainties. We also include the metal-poor bulge candidates of Howes et al. (2014; filled blue squares) and Casey & Schlaufman (2015; open blue squares), the r-process enriched bulge star from Johnson et al. (2013b; orange diamond), and blue points designate the bulge sample of Johnson et al. (2012,2014). Finally, black dots are halo stars from Roederer et al. (2014), while black triangles are upper limits from that study. Note that their sample extended as metal-poor as [Fe/H] = −4.6 dex, but we truncated the axis for better readability.
Current usage metrics show cumulative count of Article Views (full-text article views including HTML views, PDF and ePub downloads, according to the available data) and Abstracts Views on Vision4Press platform.
Data correspond to usage on the plateform after 2015. The current usage metrics is available 48-96 hours after online publication and is updated daily on week days.
Initial download of the metrics may take a while.