Fig. 7
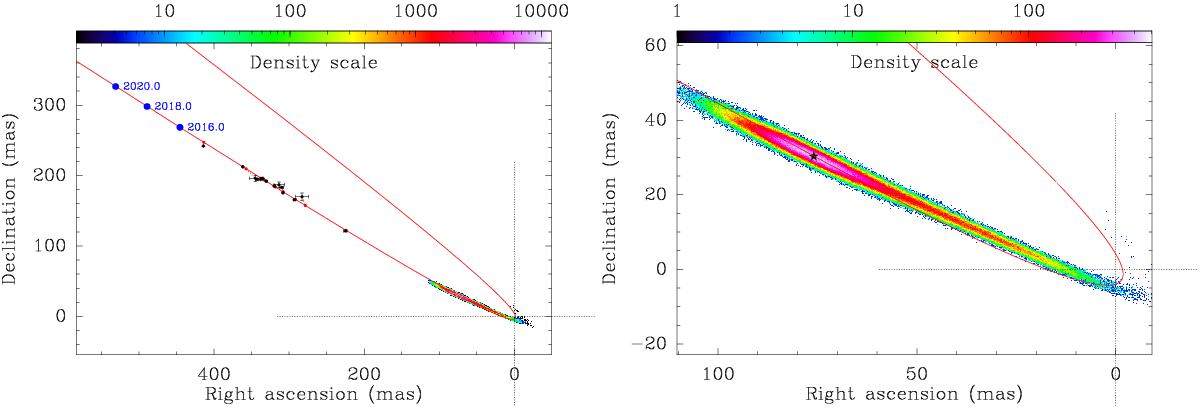
Density map of extrapolated projected position of PZ Tel B on July 22, 2003, superimposed to the best χ2 orbit. Left plot: large scale map showing the data points, the orbit, the predicted position for that orbit on 2016.0, 2018.0, 2010.0 (blue points), and the cloud of positions on July 22, 2003, computed for all solutions out of our posterior sample (shortly after periastron); right plot: enlargement of the periastron region with the cloud of projected positions. The peak of the distribution is indicated with a black star.
Current usage metrics show cumulative count of Article Views (full-text article views including HTML views, PDF and ePub downloads, according to the available data) and Abstracts Views on Vision4Press platform.
Data correspond to usage on the plateform after 2015. The current usage metrics is available 48-96 hours after online publication and is updated daily on week days.
Initial download of the metrics may take a while.