Fig. 7
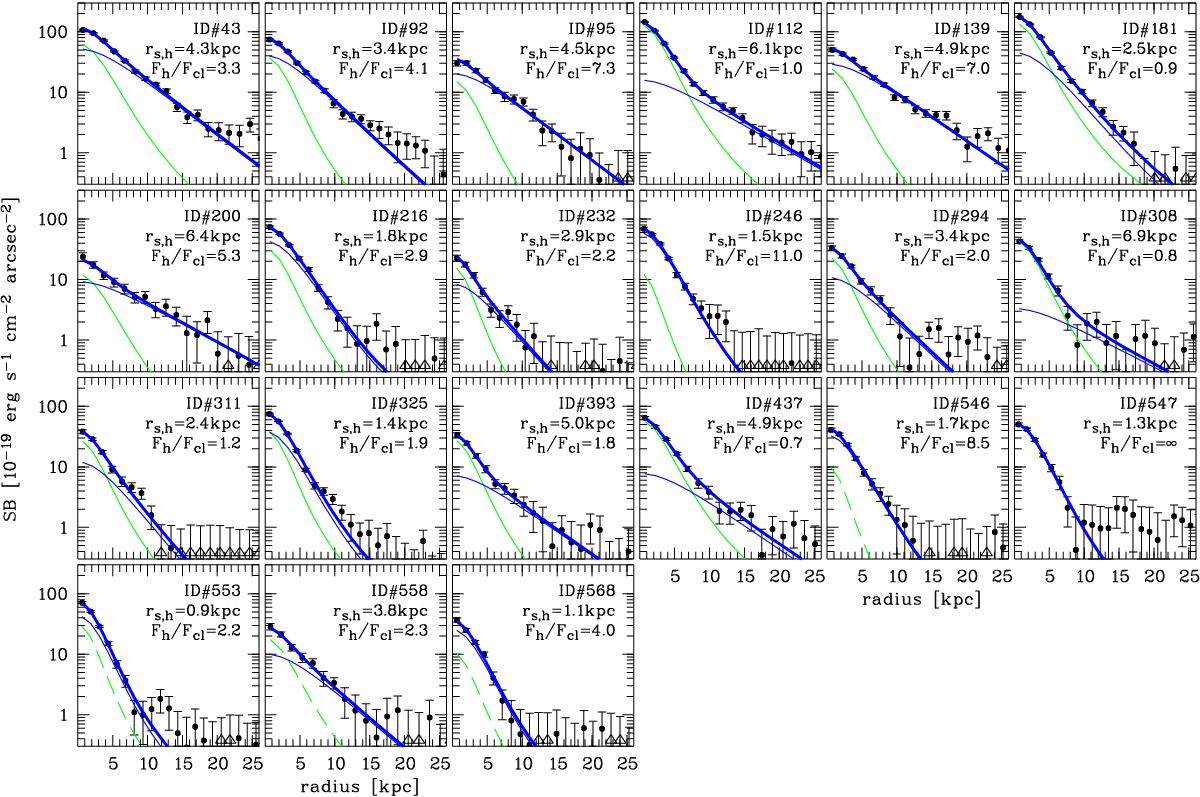
Decomposition of the observed Lyα surface brightness distributions into a compact (continuum-like) and an extended exponential component (halo), as described in the text. Only the objects with detected haloes (p0< 0.05) are shown. The datapoints are the same as in Fig. 4, but now plotted against linear radii. The green curves show the profiles of the continuum-like components (dashed for the objects without HST counterparts and thus assumed to be point sources), the thin blue lines represent the extended haloes; both convolved with the MUSE PSF. The thick blue lines show the sum of the two components.
Current usage metrics show cumulative count of Article Views (full-text article views including HTML views, PDF and ePub downloads, according to the available data) and Abstracts Views on Vision4Press platform.
Data correspond to usage on the plateform after 2015. The current usage metrics is available 48-96 hours after online publication and is updated daily on week days.
Initial download of the metrics may take a while.