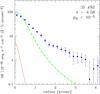
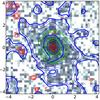
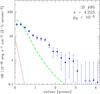
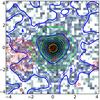
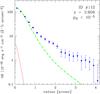
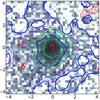
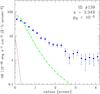
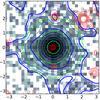
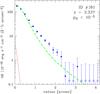
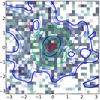
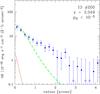
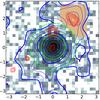
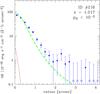
Fig. 4
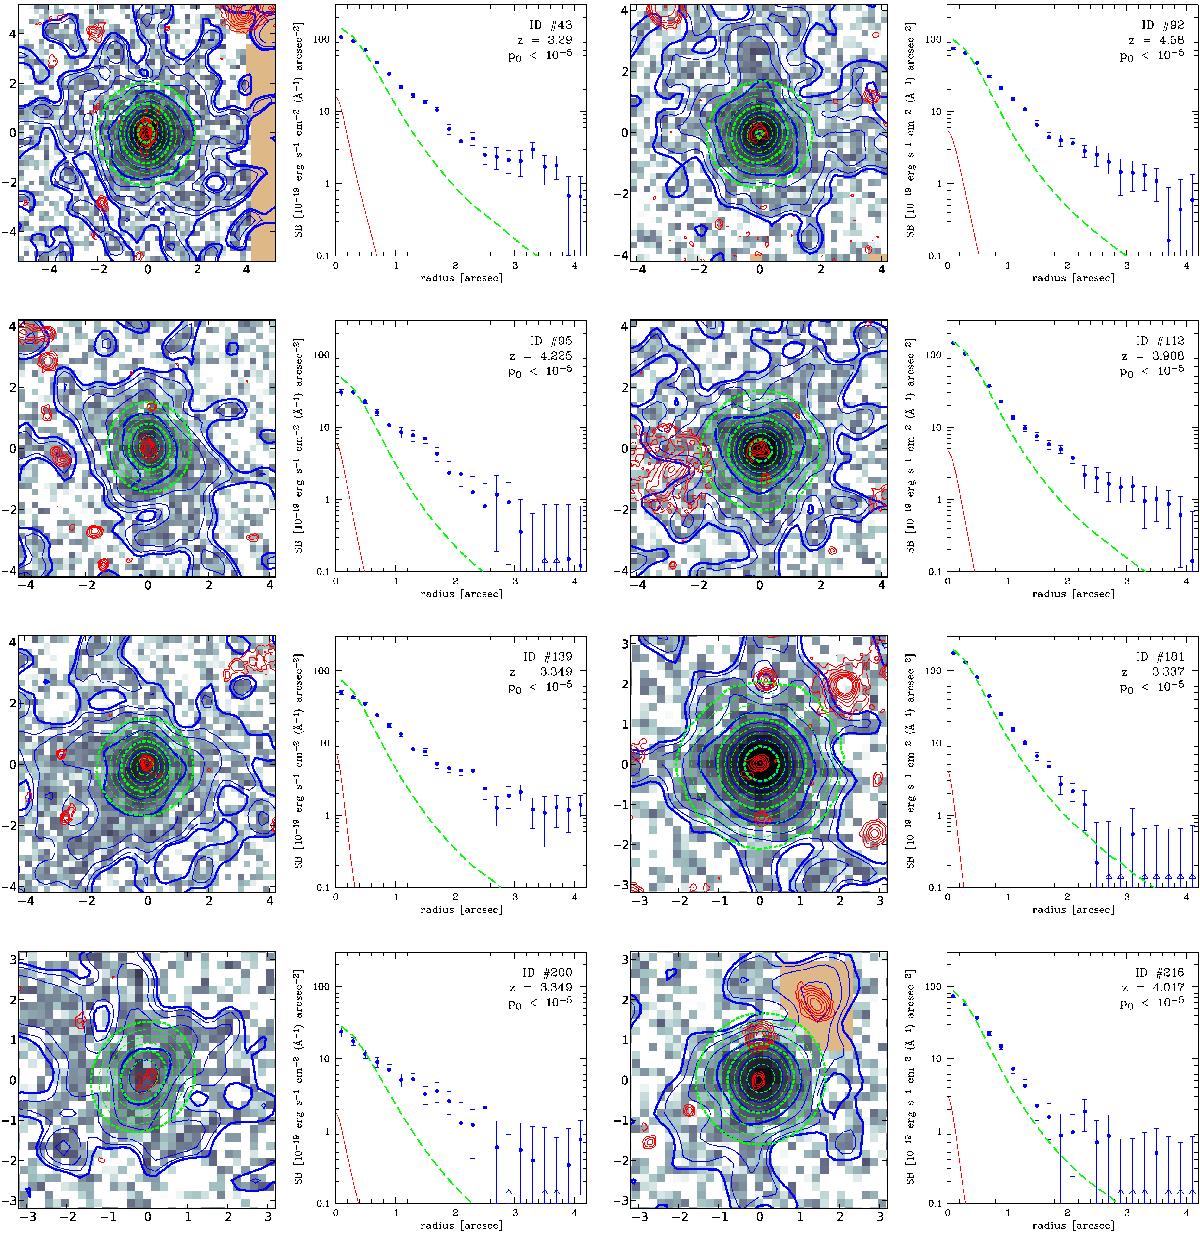
Lyα pseudo-narrowband images and radial surface brightness profiles of the LAEs in the sample, ordered by their MUSE-HDFS identifiers. Left-hand panels in each column: the greyscale pixel data show Lyα surface brightness in asinh stretch, with equal cut levels for all objects. The spatial scale in arcsec is given by the axes labels; notice that the scale varies between different objects. The blue contours also show the Lyα emission, but after smoothing to ≈ 1″ resolution to emphasise the overall distribution. The contours are spaced logarithmically by 0.25 dex, with the lowest contour level always at 1 × 10-19 erg s-1 cm-2 arcsec-2, given by the outermost thick line. Overlayed in red contours are the WFPC2 F814W images at HST resolution. The green dashed contours represent seeing-convolved UV continuum models of the central galaxies, scaled to match the Lyα emission under the null hypothesis (Sect. 3.1.3). The surface brightness levels are the same as for the Lyα contours. Light brown areas indicate regions that were masked out as explained in Sect. 2.3. Right-hand panels in each column: The blue points show the azimuthally averaged Lyα surface brightnesses measured in concentric circular annuli (triangles indicate negative values), with 1σ error bars derived as described in the text. The overplotted red lines represent the circularised UV continuum profiles measured in the HST data, in monochromatic flux density units of 10-19 erg s-1 cm-2 Å-1 arcsec-2 (note the difference in units!). A vertical red line indicates that the object is unresolved by HST and was modelled as a point source; this line is short-dashed when no counterpart to the LAE was detected in the HST image. The green dashed curves correspond to the green dashed contours in the image panels and show the modelled continuum profiles after convolution with the MUSE PSF and rescaling to match the Lyα profile under the null hypothesis. The inset labels provide object identifiers, redshifts, and the probabilities p0 of the null hypothesis that the Lyα emission follows the shape of the UV continuum, as explained in Sect. 3.3.
Current usage metrics show cumulative count of Article Views (full-text article views including HTML views, PDF and ePub downloads, according to the available data) and Abstracts Views on Vision4Press platform.
Data correspond to usage on the plateform after 2015. The current usage metrics is available 48-96 hours after online publication and is updated daily on week days.
Initial download of the metrics may take a while.