Fig. 2
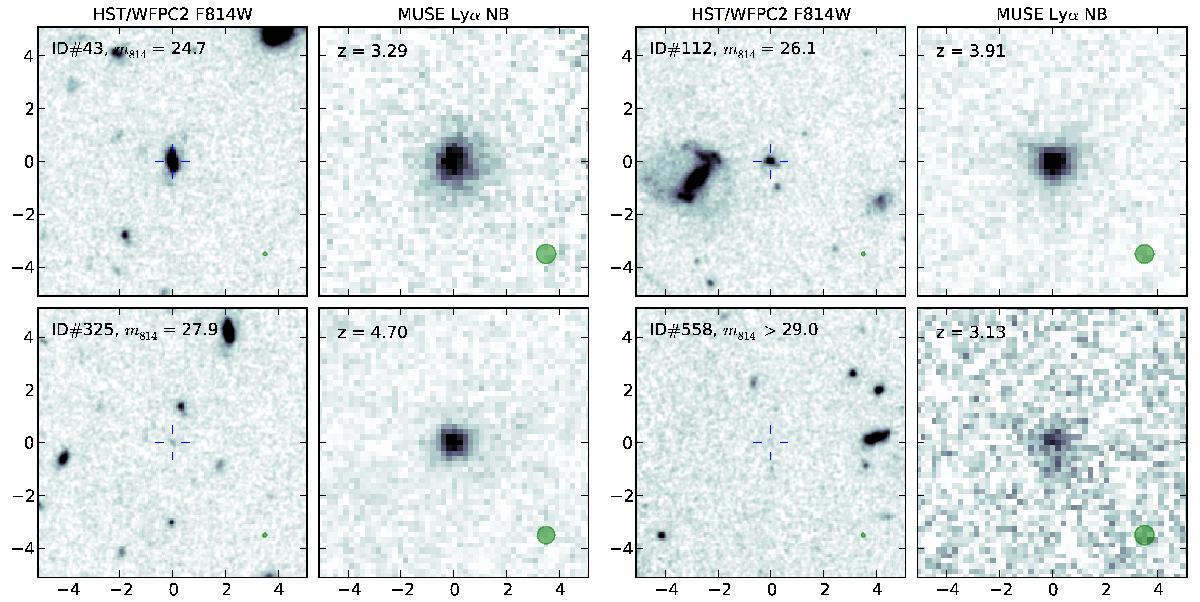
Example images of four of our Lyα emitters, showing broadband (HST/WFPC2 F814W) and MUSE continuum-subtracted pseudo-narrowband data (see text). Each panel displays an area of 10″ × 10″ centred on the LAE. The labels provide identifiers, broadband magnitudes, and redshifts. The location of each object in the HST data is marked by a blue crosswire; note that object ID#558 is not significantly detected by HST. The green circle in the lower right corner of each panel indicates the spatial resolution (FWHM of the respective point spread function).
Current usage metrics show cumulative count of Article Views (full-text article views including HTML views, PDF and ePub downloads, according to the available data) and Abstracts Views on Vision4Press platform.
Data correspond to usage on the plateform after 2015. The current usage metrics is available 48-96 hours after online publication and is updated daily on week days.
Initial download of the metrics may take a while.