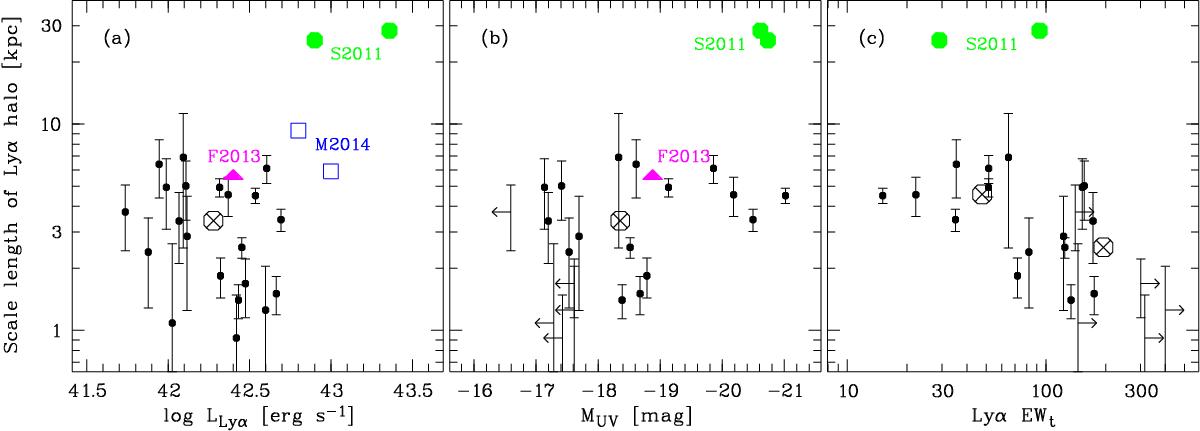
Fig. 10

Exponential scale lengths of the Lyα haloes plotted against a) total Lyα luminosities; b) absolute UV continuum magnitudes; c) total Lyα rest frame equivalent widths. Lower limits on MUV are indicated by arrows. The crossed circles give the mean values of each quantity in our sample (separately for EWt< 100 Å and EWt> 100 Å in panel c)). Other coloured symbols show values from the literature based on the stacking of narrowband images – green filled circles: Steidel et al. (2011, ⟨z⟩ = 2.65, magenta filled triangles: Feldmeier et al. (2013, C-O3 subsample, z = 3.1, blue open squares: Momose et al. (2014, z = 3.1.
Current usage metrics show cumulative count of Article Views (full-text article views including HTML views, PDF and ePub downloads, according to the available data) and Abstracts Views on Vision4Press platform.
Data correspond to usage on the plateform after 2015. The current usage metrics is available 48-96 hours after online publication and is updated daily on week days.
Initial download of the metrics may take a while.


