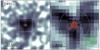
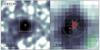
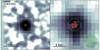
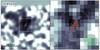
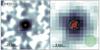
Fig. 9
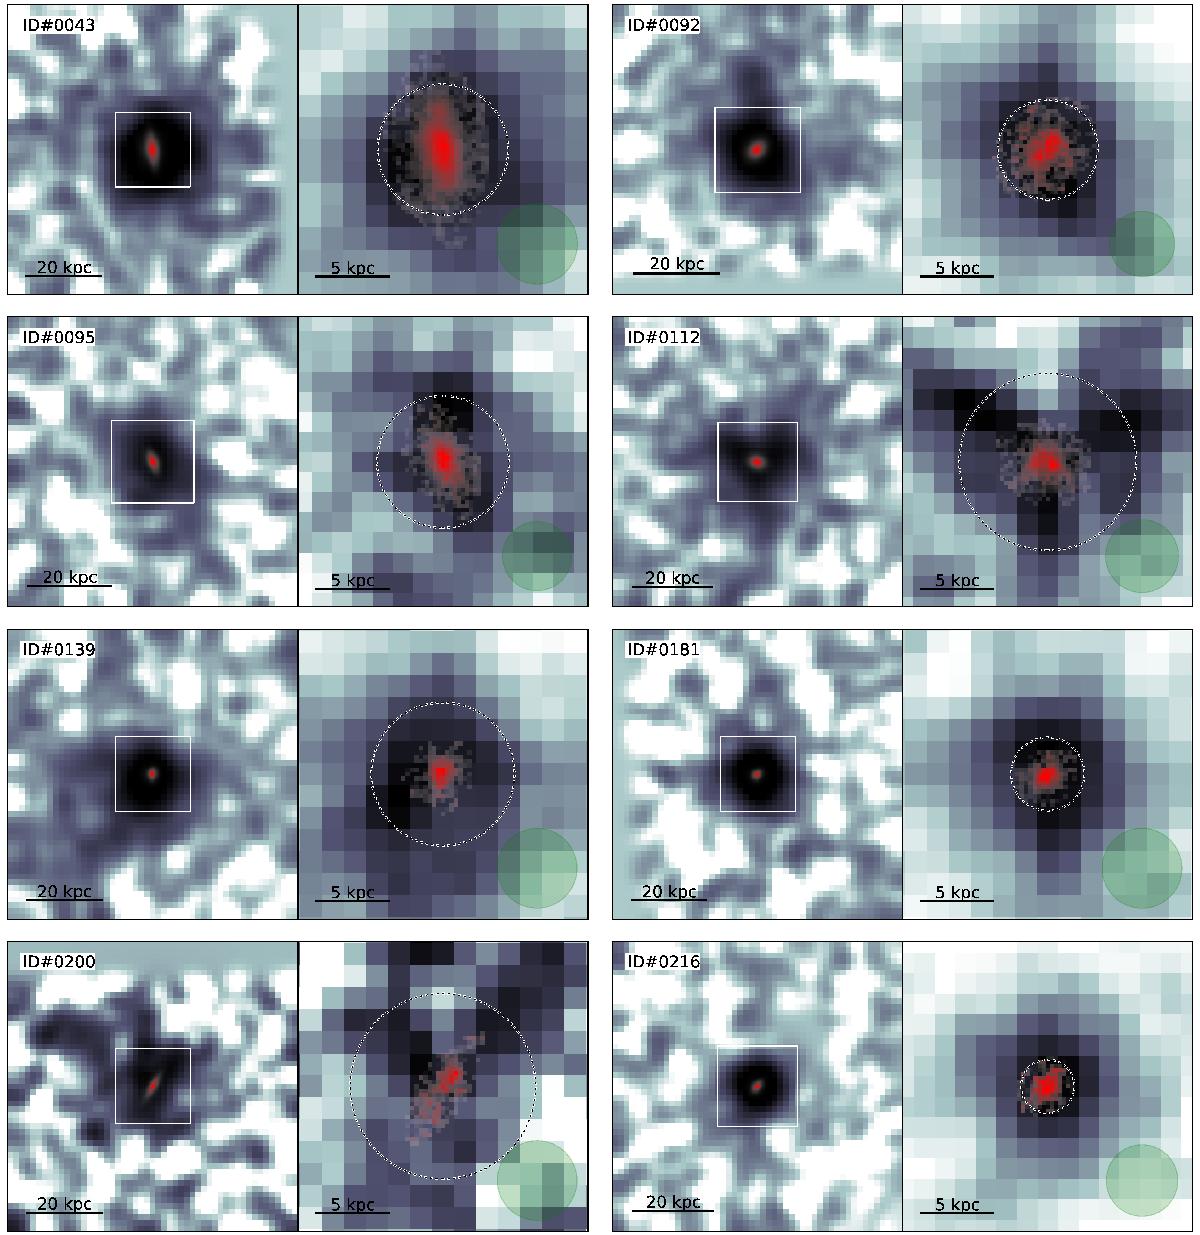
Synopsis of all detected Lyα haloes, presented in two views per object. Each image shows in greyscale the Lyα surface brightness of only the extended halo component, with a model of the continuum-like component subtracted. Left panel in each column: full-size 5″ × 5″ image, smoothed as described in the text, and displayed with fixed SB cuts from −1 to + 20×10-19 erg s-1 cm-2 arcsec-2 to emphasise the outskirts of the halo and the transition into noise. The scale bar in the lower left indicates a transverse distance of 20 kpc. A model image of the HST counterpart is superposed in red when available. The white square specifies the zoom window. Right panel in each column: zoomed 20 kpc × 20 kpc view of the same object, very slightly smoothed (see text) and with individually adjusted cut levels from 0 to the maximum pixel value, to show the bright inner region of the halo. The dotted circle centred on the object indicates the exponential scale length rs,h of the Lyα halo. The bar in the lower left shows a distance of 5 kpc. The semitransparent green circle in the lower right represents the FWHM of the MUSE PSF. Superimposed in red are the HST F814W pixel data of the object, with fore- and background sources masked out.
Current usage metrics show cumulative count of Article Views (full-text article views including HTML views, PDF and ePub downloads, according to the available data) and Abstracts Views on Vision4Press platform.
Data correspond to usage on the plateform after 2015. The current usage metrics is available 48-96 hours after online publication and is updated daily on week days.
Initial download of the metrics may take a while.