Fig. 6
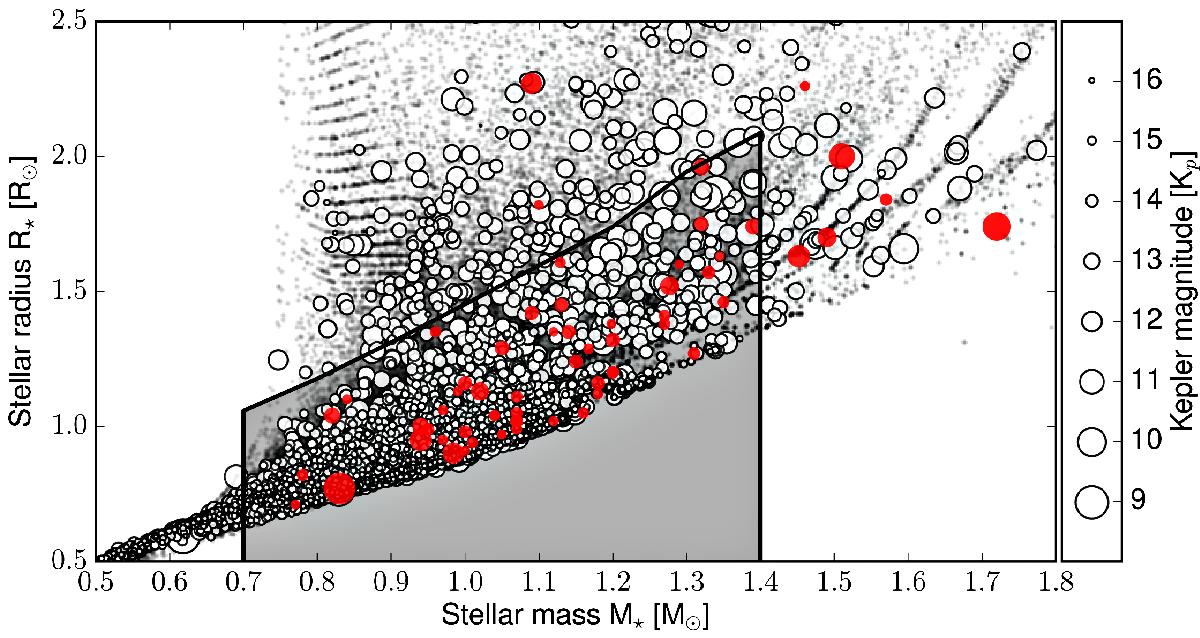
Stellar mass-radius diagramme of the targets observed by Kepler during the quarters Q1–Q16 (black dots), the candidate hosts (white circles), and the bright giant-planet hosts (red circles). The data are from Huber et al. (2014) except for the giant-planet hosts, which are taken from Table B.7. The size of the mark for the two latter samples corresponds to the Kepler magnitude. The grey region displays the selected dwarfs. One secured EGP transits a star bigger than 2.5 R⊙ (KOI-680) and is not represented here.
Current usage metrics show cumulative count of Article Views (full-text article views including HTML views, PDF and ePub downloads, according to the available data) and Abstracts Views on Vision4Press platform.
Data correspond to usage on the plateform after 2015. The current usage metrics is available 48-96 hours after online publication and is updated daily on week days.
Initial download of the metrics may take a while.