Fig. 12
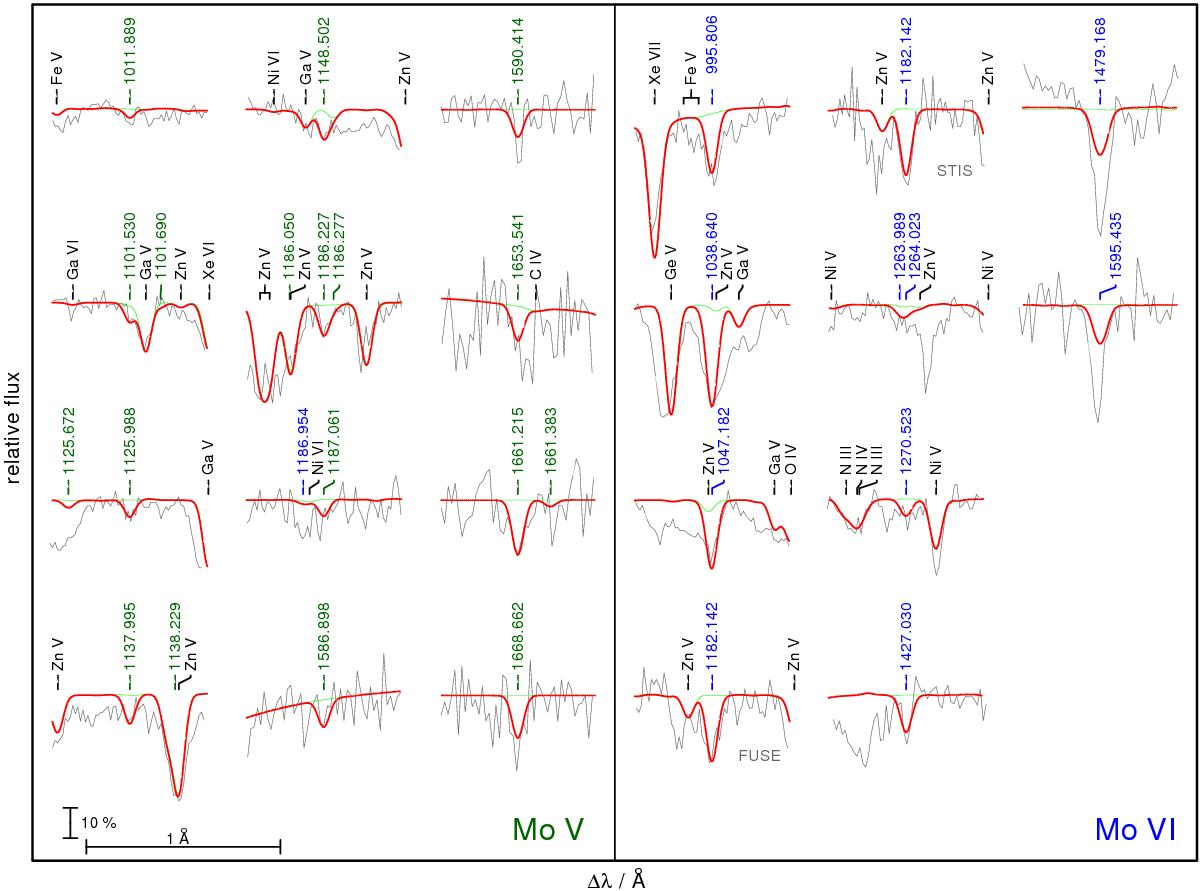
Mo v lines (left panel, marked with their wavelengths from Table A.11 in Å, green) and Mo vi lines (right panel, marked blue, wavelengths from Table A.12) in the FUSE (for lines at λ< 1188 Å) and HST/STIS (λ> 1188 Å) observations of RE 0503−289. The synthetic spectra are convolved with a Gaussian (full width at half maximum = FWHM = 0.06 Å) to simulate the instruments’ resolutions. Other identified photospheric lines are marked in black. The thick red and thin green lines show a comparison with theoretical spectra of two models with and without Mo, respectively. The vertical bar indicates 10% of the continuum flux.
Current usage metrics show cumulative count of Article Views (full-text article views including HTML views, PDF and ePub downloads, according to the available data) and Abstracts Views on Vision4Press platform.
Data correspond to usage on the plateform after 2015. The current usage metrics is available 48-96 hours after online publication and is updated daily on week days.
Initial download of the metrics may take a while.