Fig. 11
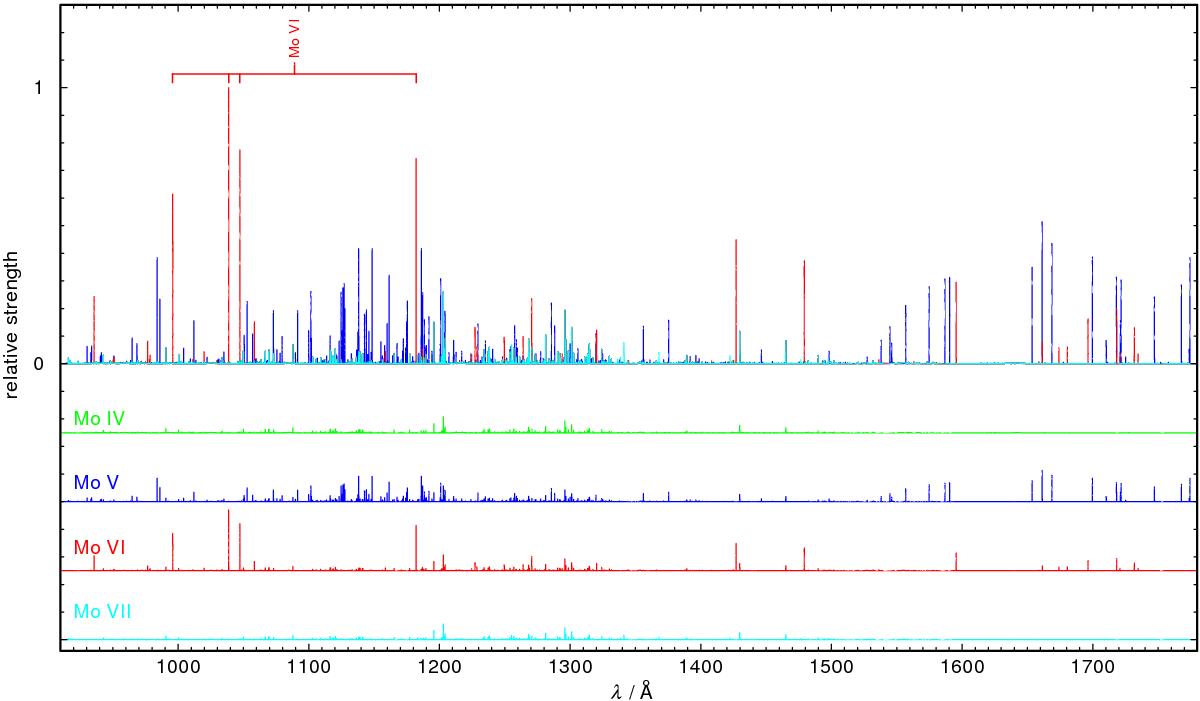
Relative strengths of Mo lines calculated from our stellar-atmosphere model of RE 0503−289. Top graph: Mo iv–vii lines, the four most prominent are Mo vi lines that were identified by Werner et al. (2012b) are marked. Graphs 2 to 5 (from top to bottom): lines of individual Mo iv–vii ions (intensities reduced by a factor of 0.22 compared to the top graph), respectively.
Current usage metrics show cumulative count of Article Views (full-text article views including HTML views, PDF and ePub downloads, according to the available data) and Abstracts Views on Vision4Press platform.
Data correspond to usage on the plateform after 2015. The current usage metrics is available 48-96 hours after online publication and is updated daily on week days.
Initial download of the metrics may take a while.