Fig. 4
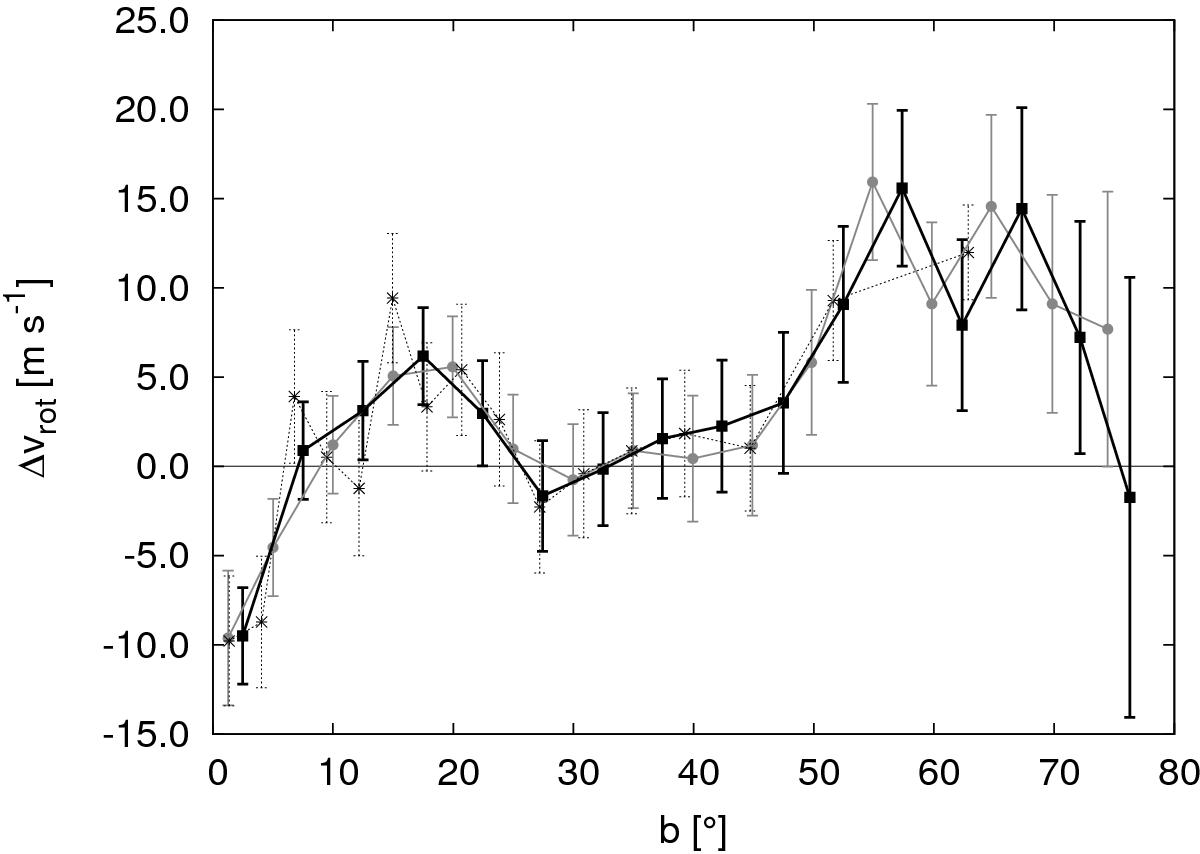
Rotation velocity residuals, Δvrot, in 5° bins in latitude, b, are shown with a thick black solid line and filled squares with error bars. Values calculated with bins of the same width, but with the first bin in the range 0°–2.5°, are shown with a grey solid line and filled circles with error bars. Δvrot averages in bins with constant number of data points (n = 5000) are shown with a dotted line and stars with error bars.
Current usage metrics show cumulative count of Article Views (full-text article views including HTML views, PDF and ePub downloads, according to the available data) and Abstracts Views on Vision4Press platform.
Data correspond to usage on the plateform after 2015. The current usage metrics is available 48-96 hours after online publication and is updated daily on week days.
Initial download of the metrics may take a while.