Fig. 7
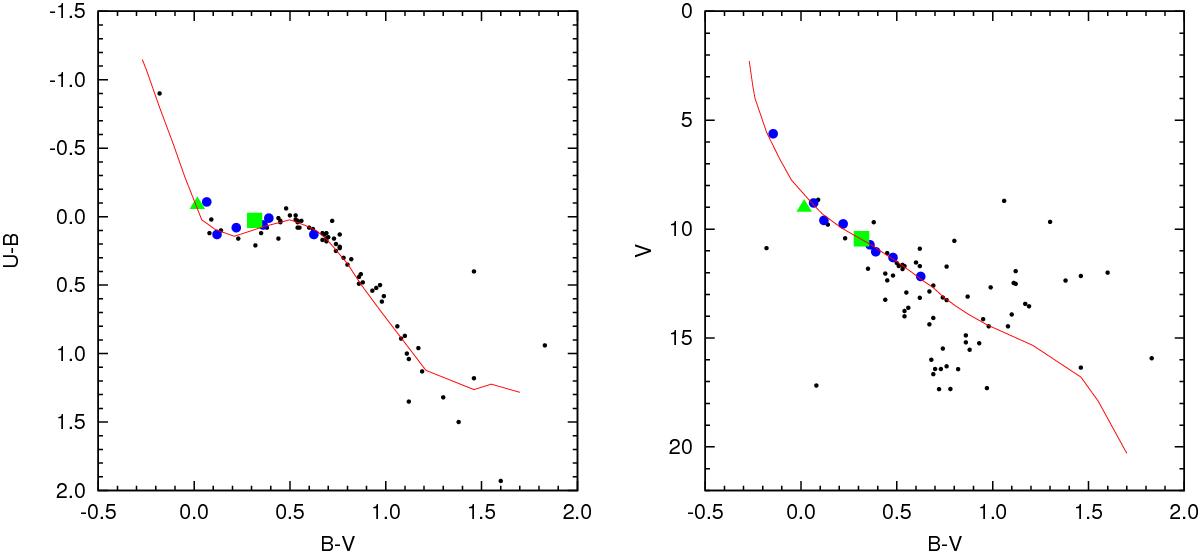
CC (left panel) and CM (right panel) diagrams for δ Lyr cluster. The solid lines represent the theoretical ZAMS shifted in both axes by appropriate amounts (see the text).The triangle and square symbols denote the primary and secondary component, respectively. Black dots represent the stars in the field of the cluster while the big blue dots represent the stars having high membership probability.
Current usage metrics show cumulative count of Article Views (full-text article views including HTML views, PDF and ePub downloads, according to the available data) and Abstracts Views on Vision4Press platform.
Data correspond to usage on the plateform after 2015. The current usage metrics is available 48-96 hours after online publication and is updated daily on week days.
Initial download of the metrics may take a while.