Fig. 4
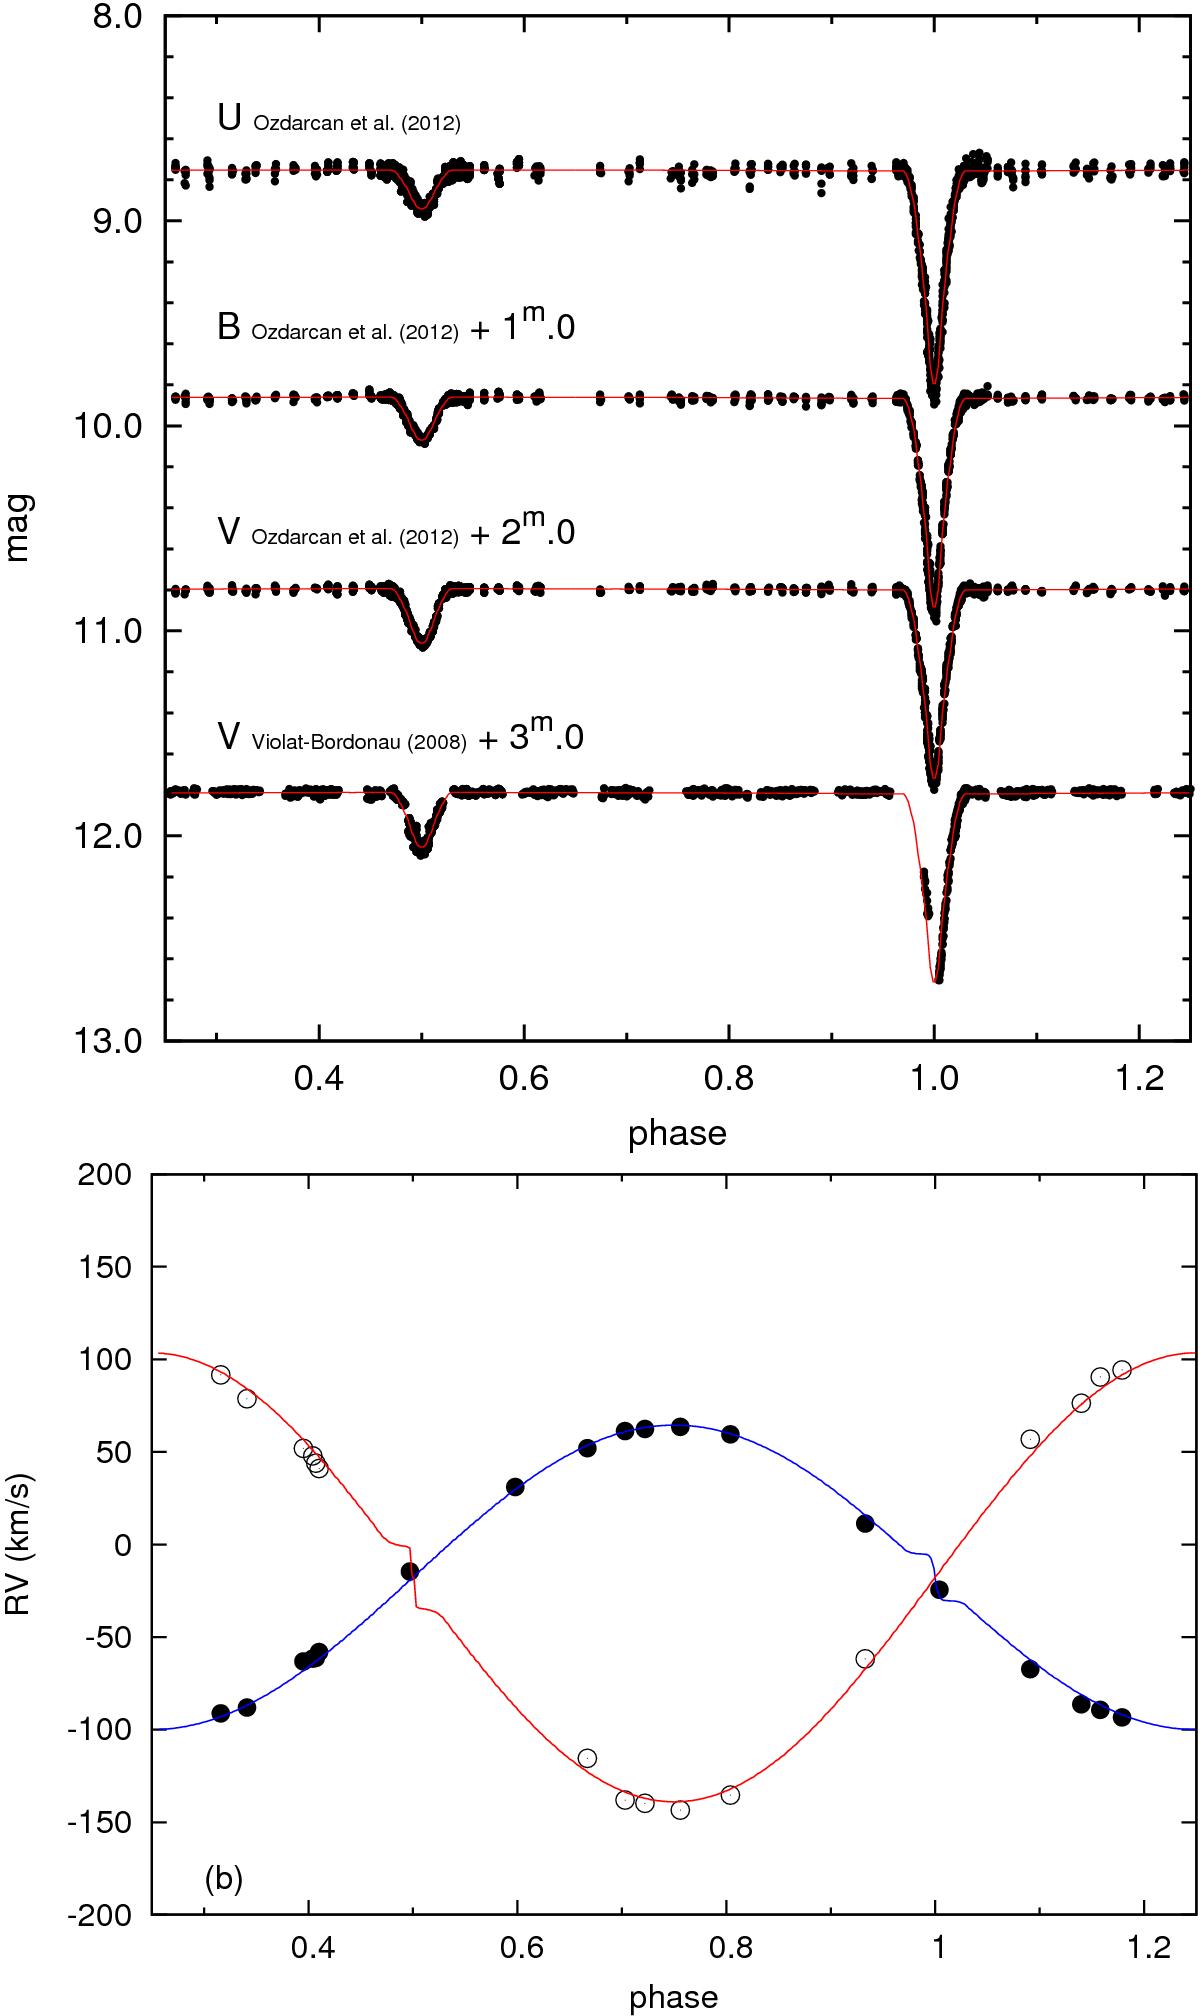
a) Observed (dots) and theoretical (solid lines) light curves of BD+36°3317. The theoretical curves are calculated using the parameters given in Table 5. b) A phase plot of RVs of BD+36°3317. Black dots and open circles denote the RVs of the primary and secondary, respectively. Solid lines show the theoretical RV curves derived with the PHOEBE program (see Sect. 3.6). We note the presence of a small Rossiter (rotational) effect.
Current usage metrics show cumulative count of Article Views (full-text article views including HTML views, PDF and ePub downloads, according to the available data) and Abstracts Views on Vision4Press platform.
Data correspond to usage on the plateform after 2015. The current usage metrics is available 48-96 hours after online publication and is updated daily on week days.
Initial download of the metrics may take a while.