Fig. 9
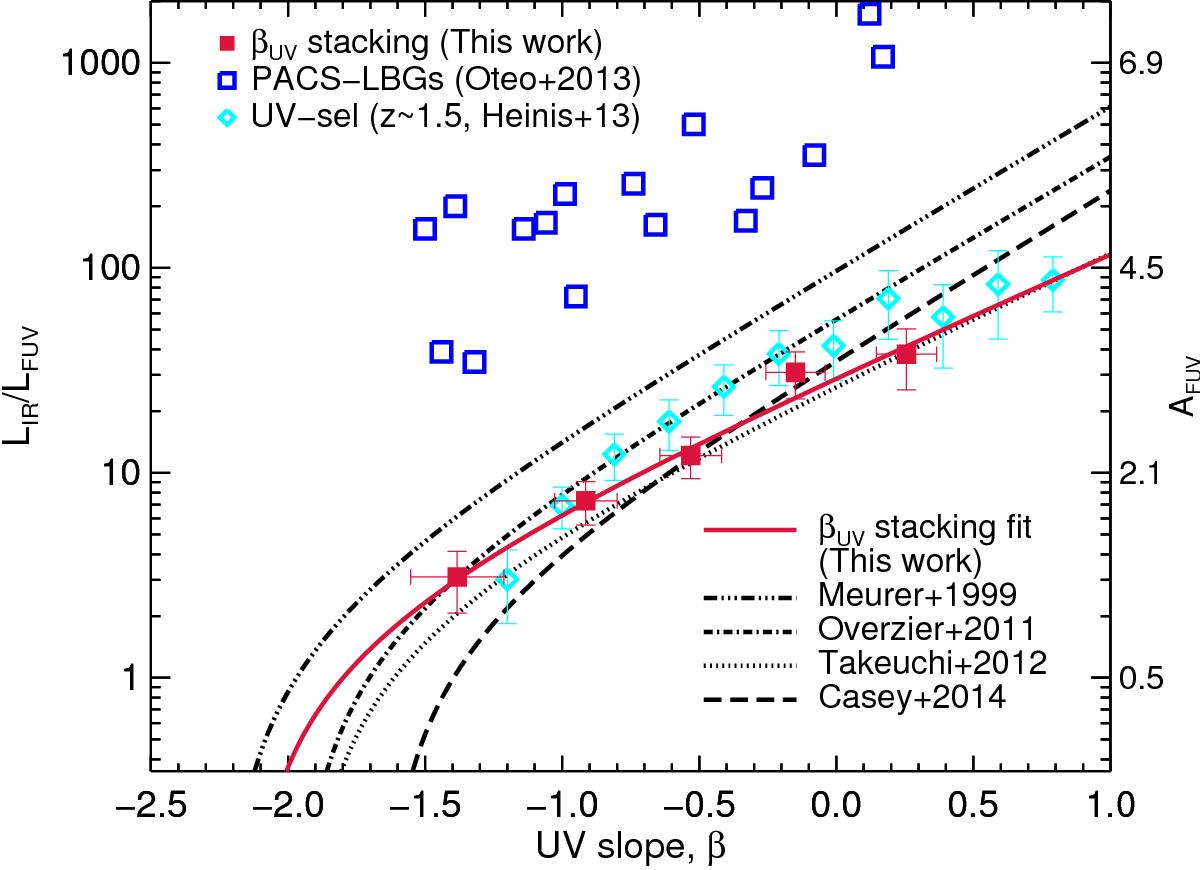
IRX-βUV diagram. The right-hand axis shows the equivalent attenuation in the FUV band, in magnitudes, computed using Eq. (5). Our data points and the best fit to Eq. (5) are shown by red squares and the red solid line, respectively. The gray circles are the results of the stacking as a function of M∗, the size of the uncertainty in the x-axis is shown in the legend. Lines show various IRX-βUV relations: the local calibration of M99 (triple-dot-dashed line), the aperture correction of the M99 relation by T12 (dotted line), O11 (solid line), and the new local calibration by Casey et al. (2015; dashed line). We show measurements at z ~ 3 from direct LBGs detection in PACS by Oteo et al. (2013; blue open square), and the results of UV-selected galaxies at z~1.5 (Heinis et al. 2013). The results from this work are in good agreement with Takeuchi et al. (2012). Oteo’s detected LBGs seem to be extracted from biased IR-bright LBGs, not representative of the average population. It is interesting to note that AFUV continuously increases with increasing stellar masses.
Current usage metrics show cumulative count of Article Views (full-text article views including HTML views, PDF and ePub downloads, according to the available data) and Abstracts Views on Vision4Press platform.
Data correspond to usage on the plateform after 2015. The current usage metrics is available 48-96 hours after online publication and is updated daily on week days.
Initial download of the metrics may take a while.