Fig. 8
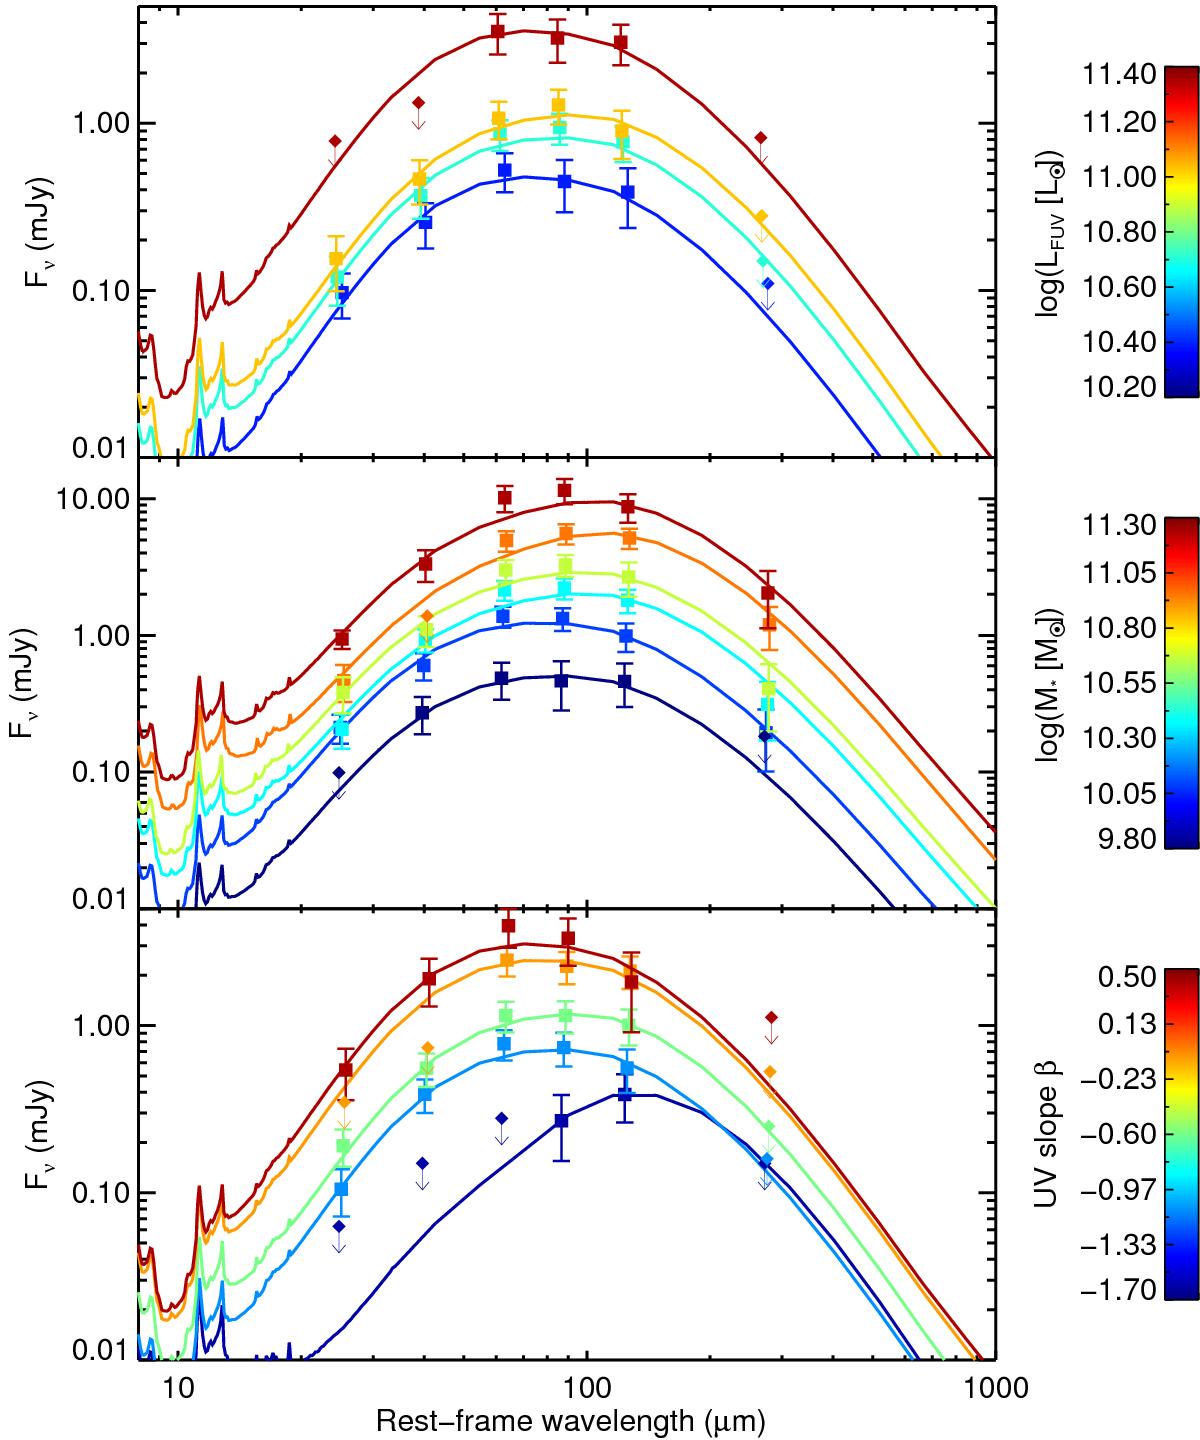
For the first time, we are able to obtain well-sampled stacked SED of the LBGs for each bin in LFUV (top), M∗ (middle) and the βUV (bottom). Data points are the average flux densities calculated from the stacking procedure in each band. The 3σ upper limits (from bootstrap resampling) are shown by an arrow. We overplot the best-fit SED from the Dale et al. (2014) templates obtained using CIGALE.
Current usage metrics show cumulative count of Article Views (full-text article views including HTML views, PDF and ePub downloads, according to the available data) and Abstracts Views on Vision4Press platform.
Data correspond to usage on the plateform after 2015. The current usage metrics is available 48-96 hours after online publication and is updated daily on week days.
Initial download of the metrics may take a while.