Fig. 5
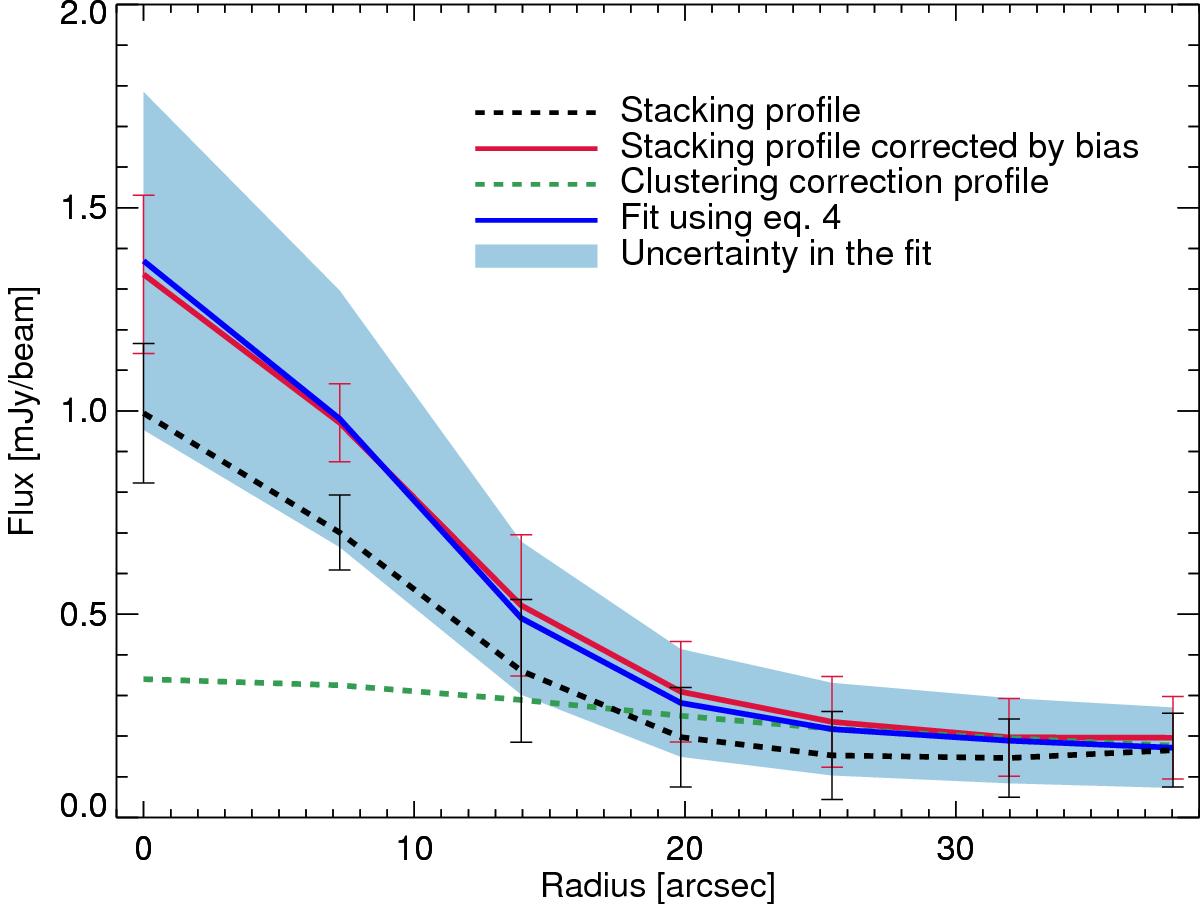
Example for the solution of Eq. (4) as a radial profile where we present the contribution of the corrections for incompleteness and clustering of the stacked galaxies. We show here the results for the third bin of the stacking as a function of LFUV in the 250 μm band (10.80 < log(LFUV[L⊙]) > 11.1, LBG-L3; see Table 1). We obtain the parameters of the fit: α = 0.99 ± 0.26, β = 0.46 ± 0.16, and γ = −0.12 ± 0.08. The black dashed line is the profile of the stacked LBGs population inside of the LFUV bin. The red line corresponds to the profile of the stacked LBGs population inside of the LFUV bin corrected for the incompleteness of the input catalogue, I (θ,φ). The green dashed line is the contribution for the clustering of the input catalogue, β × w(θ, φ) ∗ PSF(θ, φ). The blue line corresponds to the sum of the real emission of the object, α × PSF(θ , φ); the contribution for the clustering of the input catalogue, β × w(θ, φ) ∗ PSF(θ, φ); and the background, γ. The blue region shows the uncertainty of the results using bootstrap resampling. This plot is only a 1D illustration for the solution of Eq. (4), but we have solved it in 2D to obtain the stacked images for this work.
Current usage metrics show cumulative count of Article Views (full-text article views including HTML views, PDF and ePub downloads, according to the available data) and Abstracts Views on Vision4Press platform.
Data correspond to usage on the plateform after 2015. The current usage metrics is available 48-96 hours after online publication and is updated daily on week days.
Initial download of the metrics may take a while.