Fig. 14
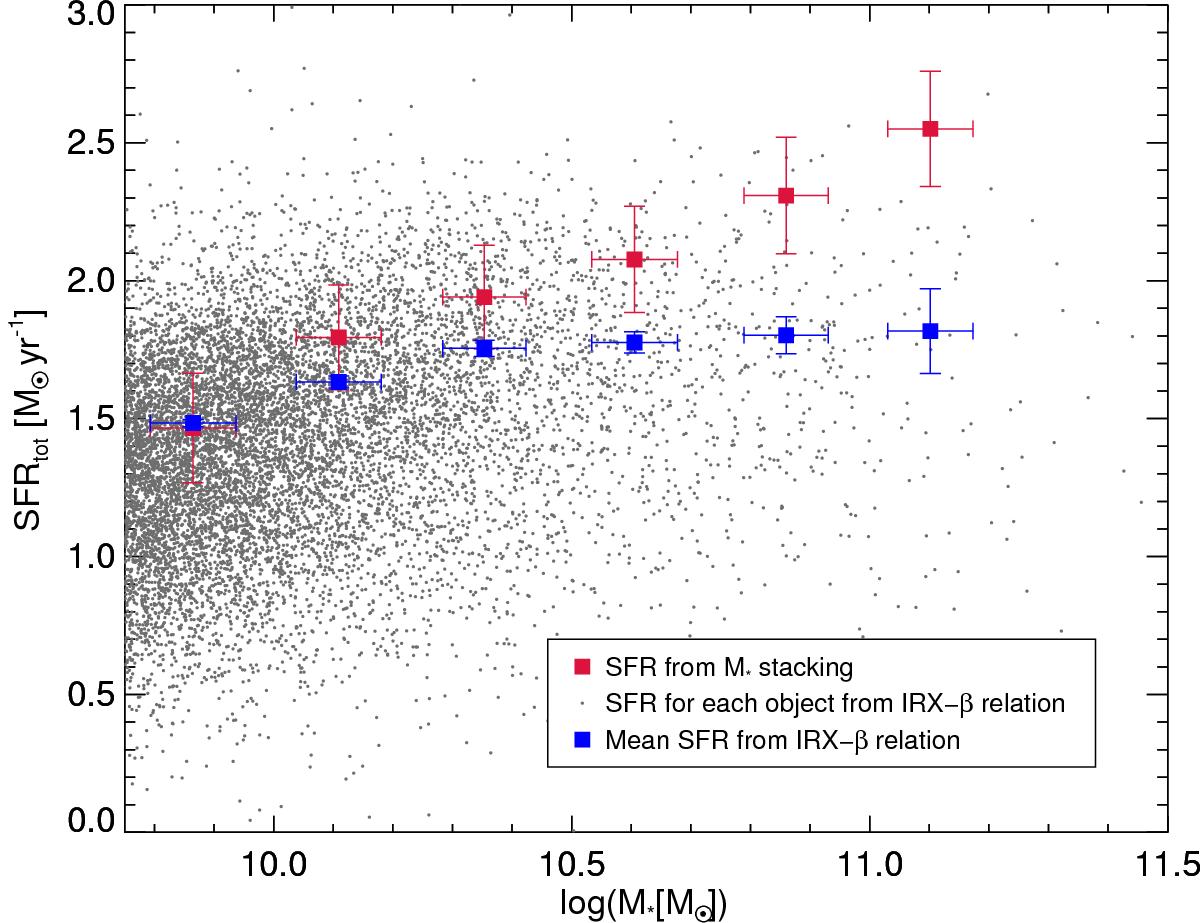
Comparison between SFRtotal and SFRcorr as a function of M∗. The red filled squares show the SFRtotal from the stacking results as a function of M∗. The gray point are the individual SFRcorr values for each LBG of our sample. The blue filled squares show the average of the SFRcorr; the error bars represent the error on the mean (σ/![]() ).
).
Current usage metrics show cumulative count of Article Views (full-text article views including HTML views, PDF and ePub downloads, according to the available data) and Abstracts Views on Vision4Press platform.
Data correspond to usage on the plateform after 2015. The current usage metrics is available 48-96 hours after online publication and is updated daily on week days.
Initial download of the metrics may take a while.