Fig. 12
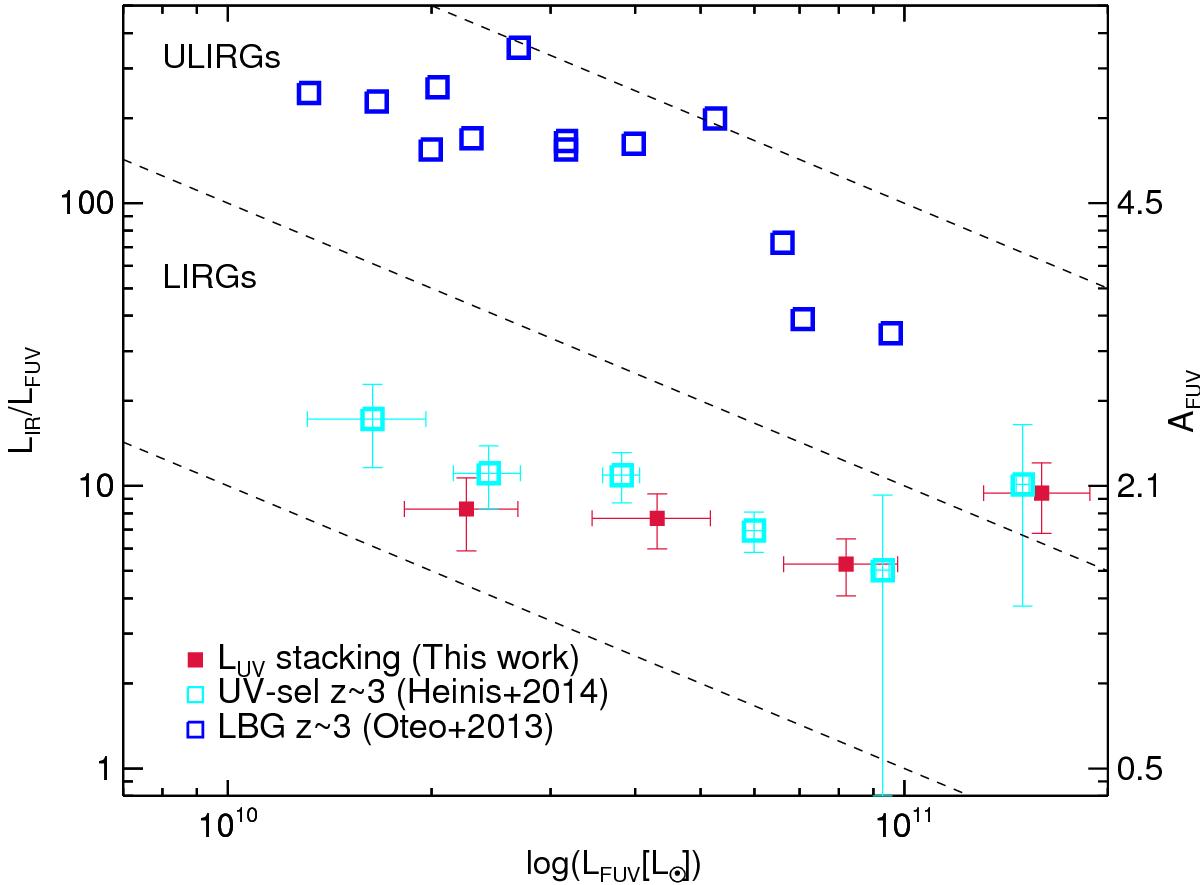
IRX versus LFUV.The right-hand axis shows the equivalent attenuation in the FUV band in magnitudes using Eq. (5). Our data points are shown as red squares. We also show previous measurements at z ~ 3 from stacking of UV-selected galaxies in the COSMOS field by Heinis et al. (2014; cyan open squares) and LBGs detected in PACS by Oteo et al. (2013; blue open square). The dashed lines represent the region where LIRG and ULIRG lie.
Current usage metrics show cumulative count of Article Views (full-text article views including HTML views, PDF and ePub downloads, according to the available data) and Abstracts Views on Vision4Press platform.
Data correspond to usage on the plateform after 2015. The current usage metrics is available 48-96 hours after online publication and is updated daily on week days.
Initial download of the metrics may take a while.