Fig. 11
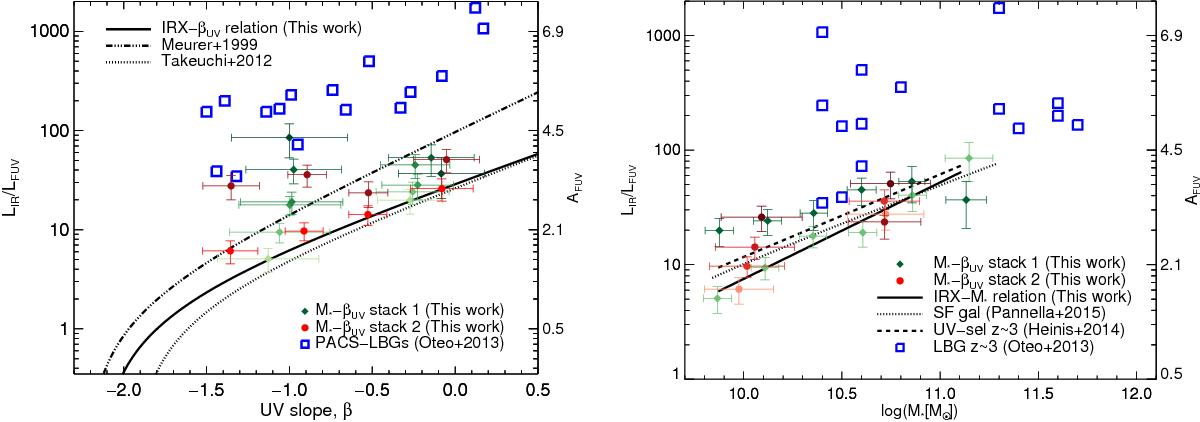
Results for stack 1 (green) and stack 2 (red) in the IRX-βUV and IRX-M∗ plane. Left panel: IRX-βUV diagram, for reference see Fig. 9. The stack 1 results are shown as diamonds, the tonalities of green represent the increase of the M∗ from 9.75 (light green) to 11.50 (dark green). The filled red circles are the results from stack 2, the tonalities of red represent the two different bins in M∗, 9.75 < log (M∗ [ M⊙ ] ) < 10.5 (light red) and 10.5 < log (M∗ [ M⊙ ] ) < 11.5 (dark red). Right panel: IRX-M∗ diagram, for reference see Fig. 10. The stack 1 results are shown as diamonds, the tonalities of green represent the two different bins in βUV, −1.7 <βUV< −0.5 (light green) and −0.5 <βUV< 0.5 (dark green). The filled red circles are the results from stack 2, the tonalities of red represent the increase of the βUV from −1.7 (light red) to 0.5 (dark red).
Current usage metrics show cumulative count of Article Views (full-text article views including HTML views, PDF and ePub downloads, according to the available data) and Abstracts Views on Vision4Press platform.
Data correspond to usage on the plateform after 2015. The current usage metrics is available 48-96 hours after online publication and is updated daily on week days.
Initial download of the metrics may take a while.