Fig. 1

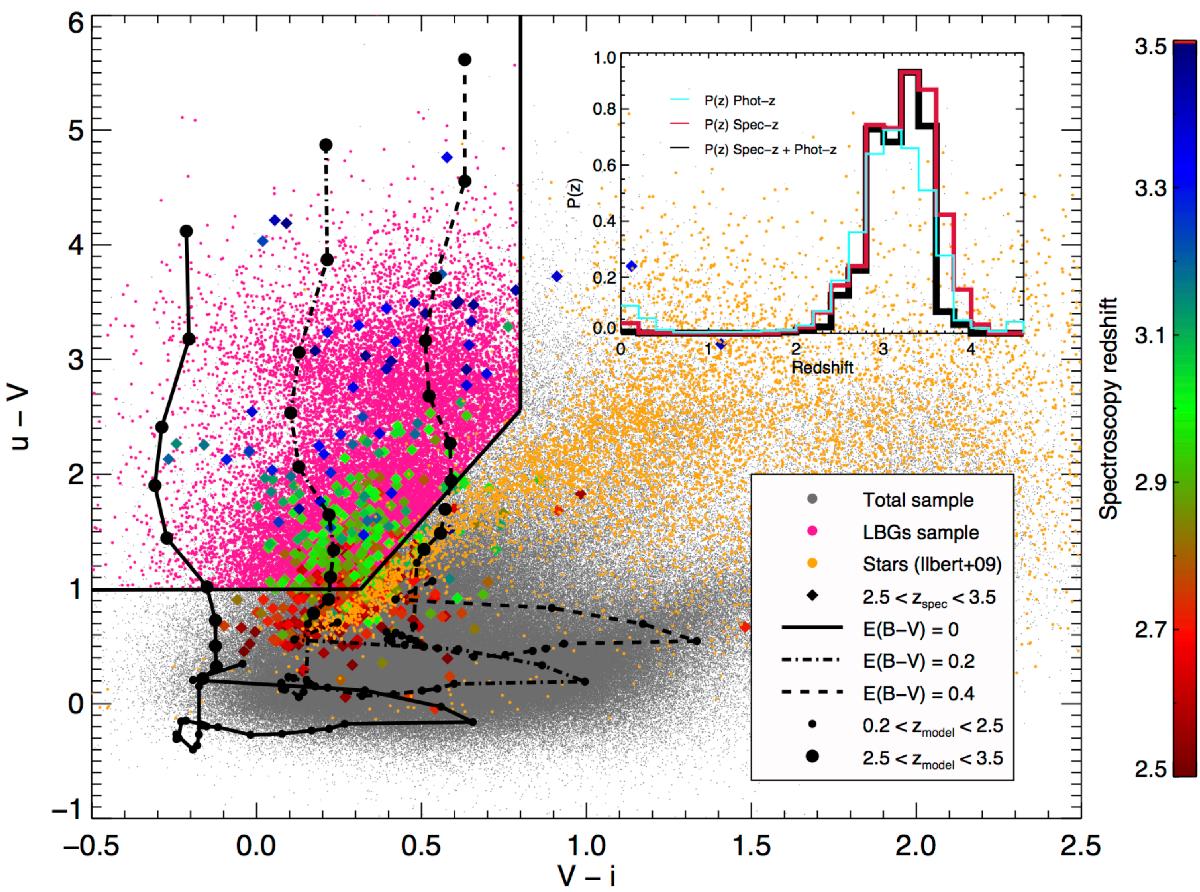
Selection of the LBGs in the color-color diagram. The small gray dots are the sample of objects detected in the COSMOS field, which have magnitudes (VJ< 26.5 and i+< 26.1), and photo-z calculated from Ilbert et al. (2009, version 2.0). The pink dots are our sample selected within the limits of Eq. (1) (black lines), with photometric redshift between 2.5 and 3.5 and log(LFUV[L⊙]) > 10.2. The yellow dots are the stars identified by Ilbert et al. (2009, version 2.0). The diamonds correspond to the objects with spectroscopic redshift identify in the range 2.5 <zspec< 3.5, color-coded red to blue as a function of their zspec. The black lines correspond to the expected colors in redshift evolution (small dots, 0.2 ≤ z ≤ 2.5; large dots, 2.5 ≤ z ≤ 3.5) for three fiducial star-forming galaxies (see Sect. 3.3.1) with E(B − V) = 0,0.2, and 0.4. The panel inserted in the top right corner shows the probability of finding an object in the redshift range 2.5 ≤ z ≤ 3.5 for our selection. The blue and red lines are the probability of finding an object with a good photo-z or spectrocopic redshift (available within the COSMOS collaboration), respectively. The back line is the probability of finding an object with a spectroscopic redshift after selecting the objects with photo-z in the range 2.5 ≤ z ≤ 3.5 as we did in our sample selection (which corresponds to our redshift probability as a function of redshift).
Current usage metrics show cumulative count of Article Views (full-text article views including HTML views, PDF and ePub downloads, according to the available data) and Abstracts Views on Vision4Press platform.
Data correspond to usage on the plateform after 2015. The current usage metrics is available 48-96 hours after online publication and is updated daily on week days.
Initial download of the metrics may take a while.


