Fig. 8
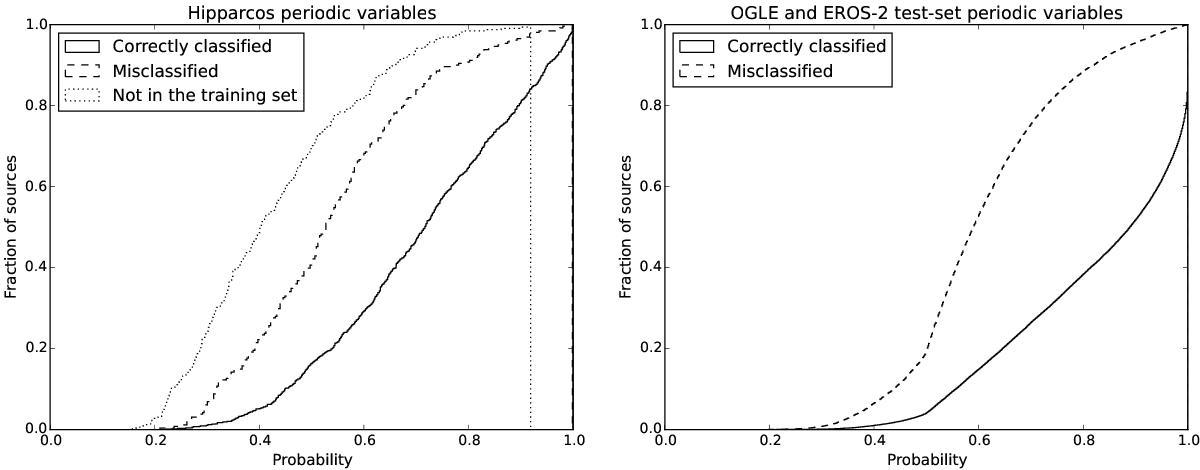
Fraction of sources (y-axis) whose probabilities of the accepted classes are lower than a certain probability (x-axis) for the Hipparcos periodic variables (left panel) and the OGLE/EROS-2 validation test-set, T2 (see Sect. 2.3), (right panel). The correctly classified sources (solid line) have generally higher probability than other two groups, each of which is 1) the misclassified sources (dashed line), and 2) the sources whose variability types are not in the training set (dotted line).
Current usage metrics show cumulative count of Article Views (full-text article views including HTML views, PDF and ePub downloads, according to the available data) and Abstracts Views on Vision4Press platform.
Data correspond to usage on the plateform after 2015. The current usage metrics is available 48-96 hours after online publication and is updated daily on week days.
Initial download of the metrics may take a while.