Free Access
Fig. 5
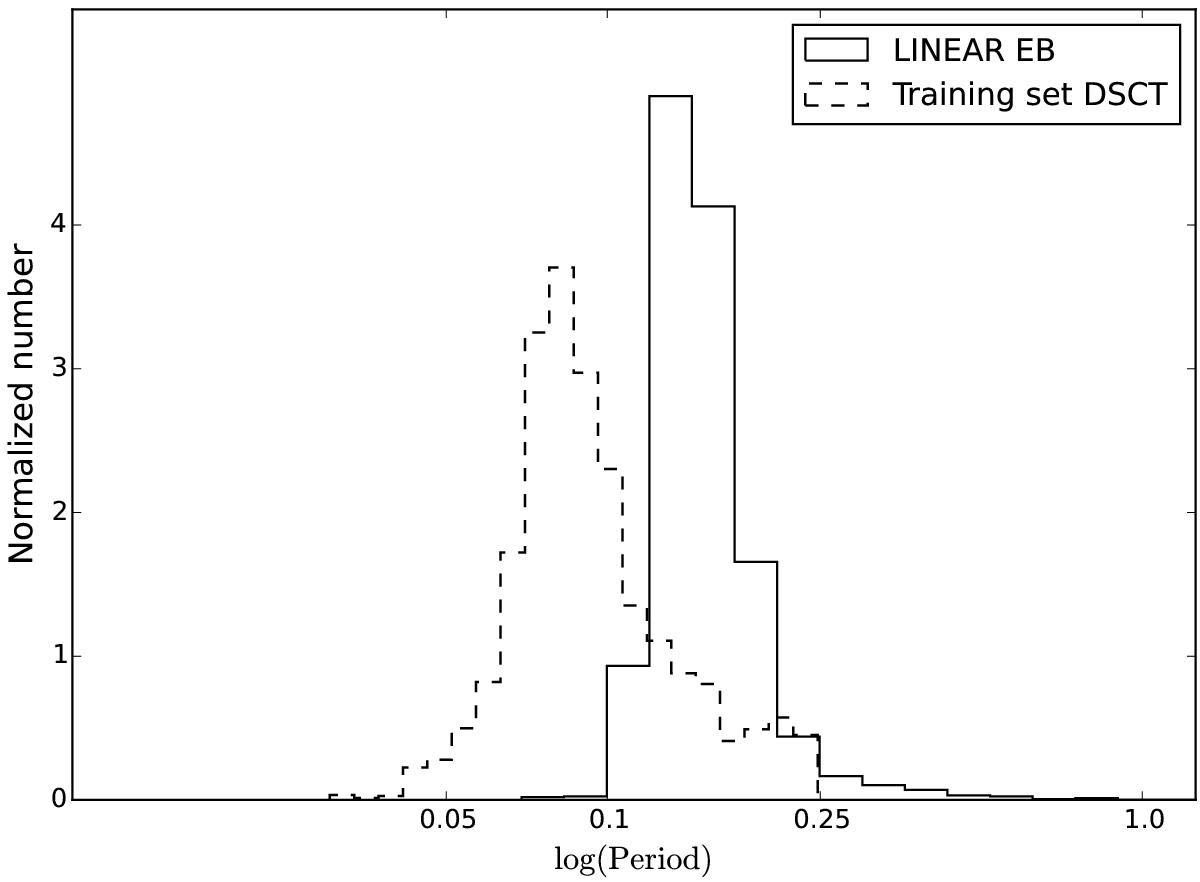
Period histograms of EB (solid line) from the LINEAR dataset. LINEAR EB have relatively shorter periods, which could cause misclassification of them into the short-period variables such as DSCT. The dashed line is a period histogram of the training set DSCT.
Current usage metrics show cumulative count of Article Views (full-text article views including HTML views, PDF and ePub downloads, according to the available data) and Abstracts Views on Vision4Press platform.
Data correspond to usage on the plateform after 2015. The current usage metrics is available 48-96 hours after online publication and is updated daily on week days.
Initial download of the metrics may take a while.