Fig. 3
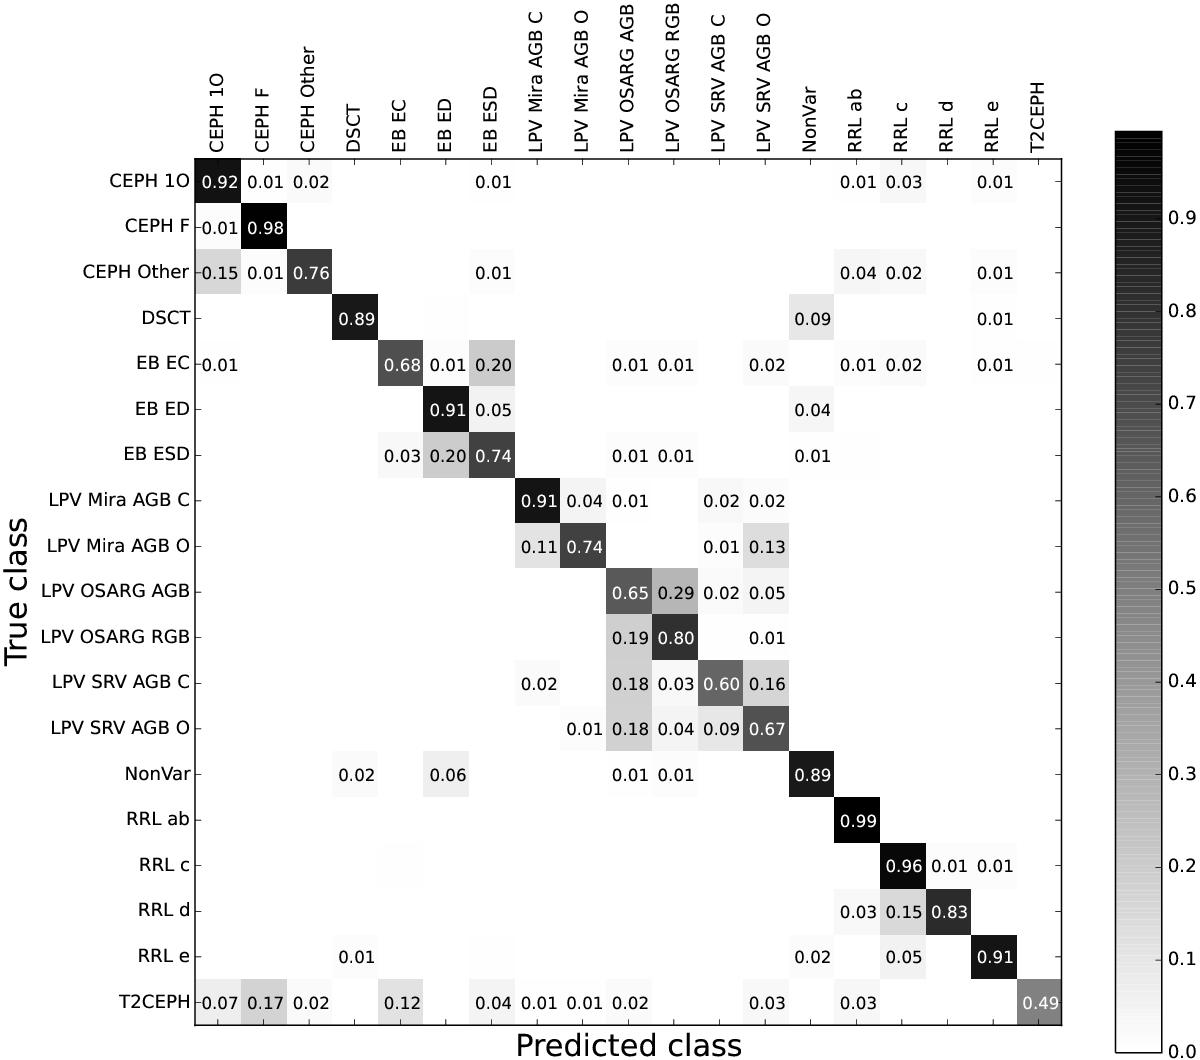
Confusion matrix of the subclass model. Each cell shows the fraction of objects of that true class (rows) assigned to the predicted classes (columns) on a gray scale. Thus the values on the leading diagonal are the recall rate (Eq. (8)). We show the number only if it is larger than or equal to 0.01. See Table 4 for the numerical values of the recall and precision for each class.
Current usage metrics show cumulative count of Article Views (full-text article views including HTML views, PDF and ePub downloads, according to the available data) and Abstracts Views on Vision4Press platform.
Data correspond to usage on the plateform after 2015. The current usage metrics is available 48-96 hours after online publication and is updated daily on week days.
Initial download of the metrics may take a while.