Free Access
Fig. A.1
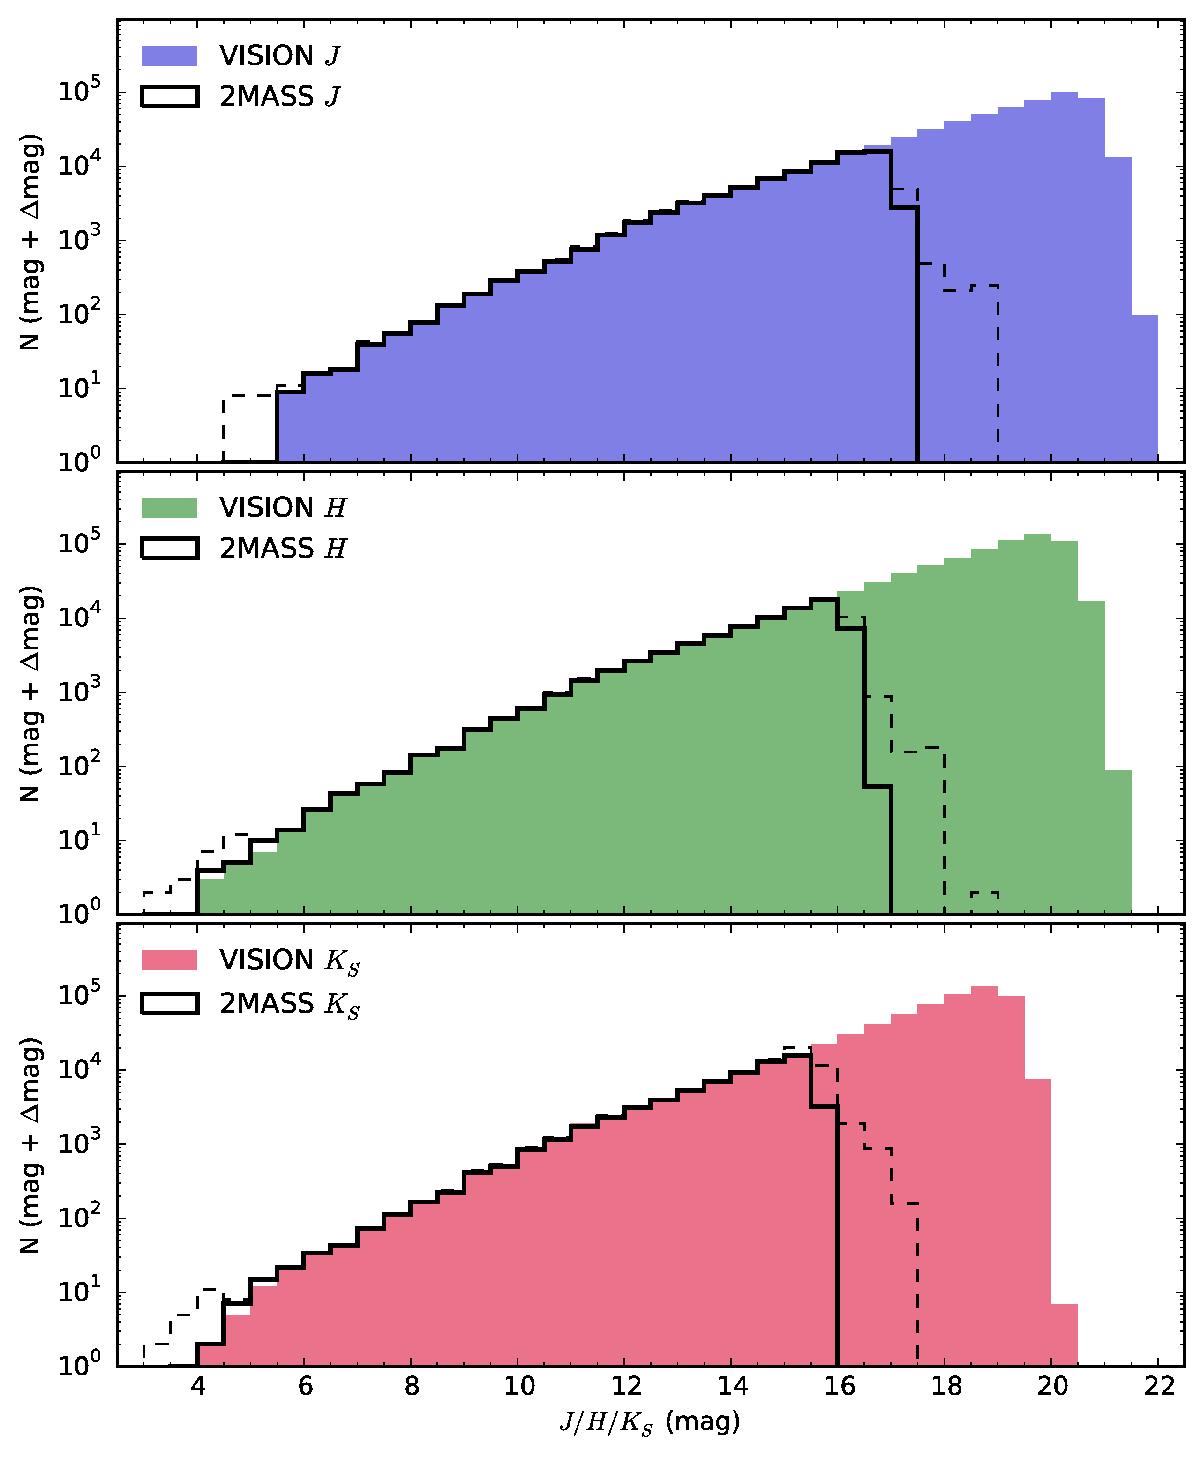
Luminosity functions (histograms) for the three observed bands with bin widths of 0.5 mag. The solid black lines represent the 2MASS histograms for sources with a quality flag of at least C for the same coverage as the VISTA survey. The dashed lines show the complete 2MASS histograms.
Current usage metrics show cumulative count of Article Views (full-text article views including HTML views, PDF and ePub downloads, according to the available data) and Abstracts Views on Vision4Press platform.
Data correspond to usage on the plateform after 2015. The current usage metrics is available 48-96 hours after online publication and is updated daily on week days.
Initial download of the metrics may take a while.