Free Access
Fig. A.1
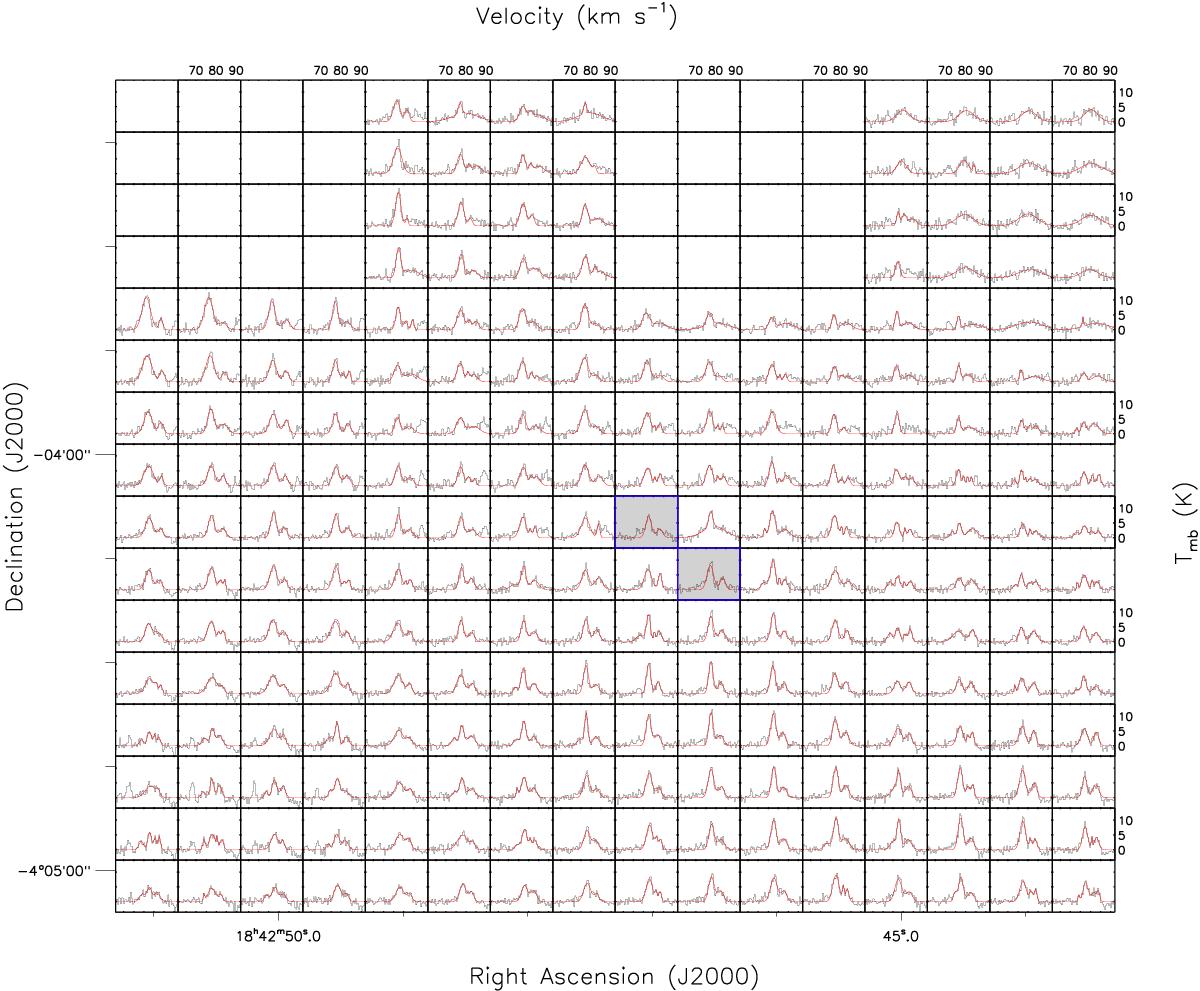
12CO J = 3 → 2 spectra towards the C1 clump, as observed by the JCMT. The red lines show the cumulative fit of all detected components. The spectra outlined in blue and shown with grey backgrounds indicate the pixels closest to the C1-N and C1-S cores with the C1-N core being the northern source.
Current usage metrics show cumulative count of Article Views (full-text article views including HTML views, PDF and ePub downloads, according to the available data) and Abstracts Views on Vision4Press platform.
Data correspond to usage on the plateform after 2015. The current usage metrics is available 48-96 hours after online publication and is updated daily on week days.
Initial download of the metrics may take a while.