Free Access
Fig. 11
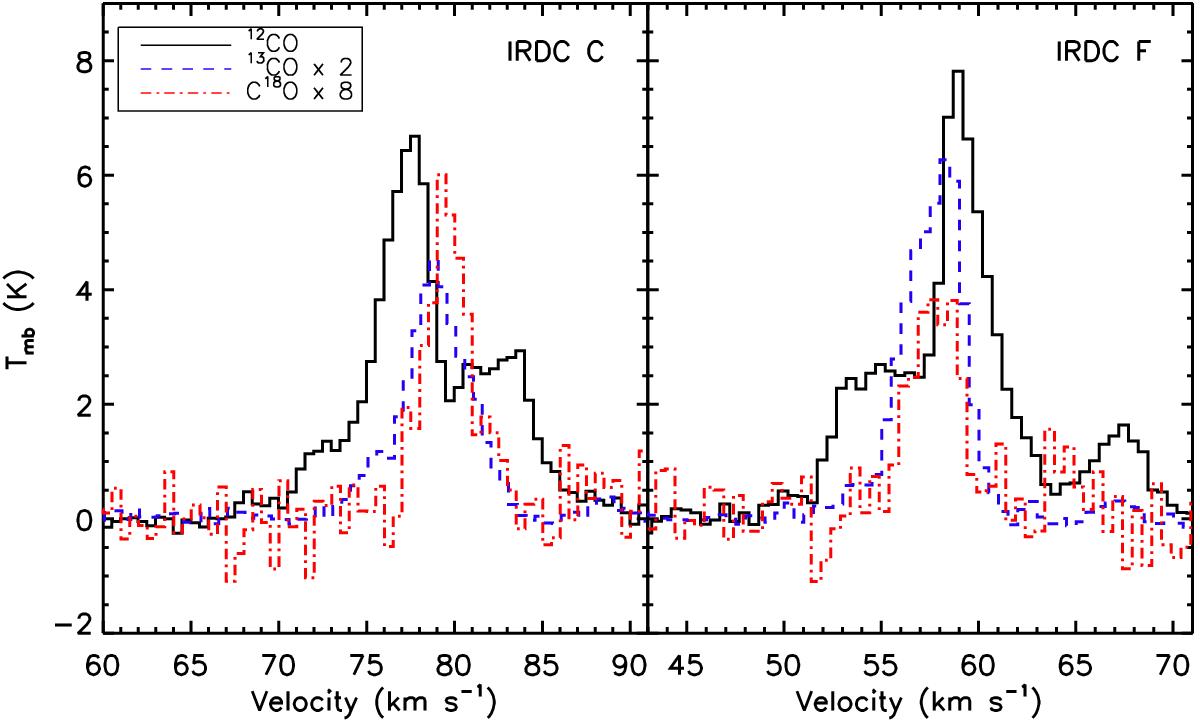
Spatially averaged spectra of the 12CO (black), 13CO (blue, dashed), and C18O (red, dash-dotted) J = 3 → 2 lines over IRDC C (left) and IRDC F (right). The 13CO data have been scaled up by a factor of two while the C18O data have been scaled up by a factor of 8.
Current usage metrics show cumulative count of Article Views (full-text article views including HTML views, PDF and ePub downloads, according to the available data) and Abstracts Views on Vision4Press platform.
Data correspond to usage on the plateform after 2015. The current usage metrics is available 48-96 hours after online publication and is updated daily on week days.
Initial download of the metrics may take a while.