Free Access
Fig. 9
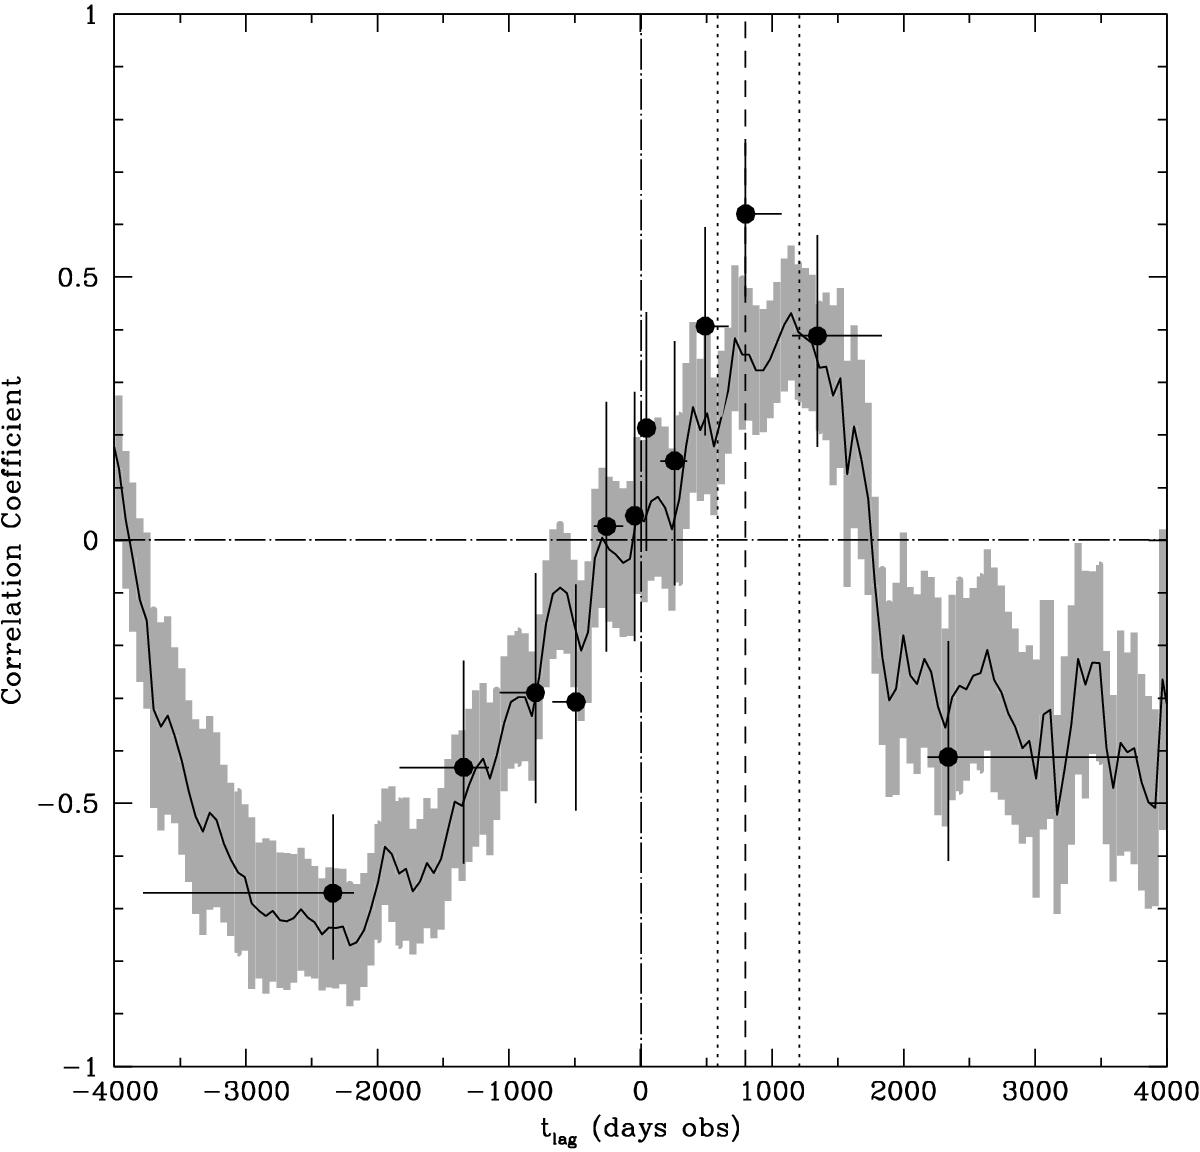
Cross-correlation function of the BAL EW with the NAL EW variability. Both the ICCF (solid line) and the ZDCF computed with 20 points per bin (black dots) are shown with their respective 1σ errors. The ZDCF lag (dashed line) is indicated along with its uncertainty at 68% probability (dotted lines).
Current usage metrics show cumulative count of Article Views (full-text article views including HTML views, PDF and ePub downloads, according to the available data) and Abstracts Views on Vision4Press platform.
Data correspond to usage on the plateform after 2015. The current usage metrics is available 48-96 hours after online publication and is updated daily on week days.
Initial download of the metrics may take a while.