Fig. 8
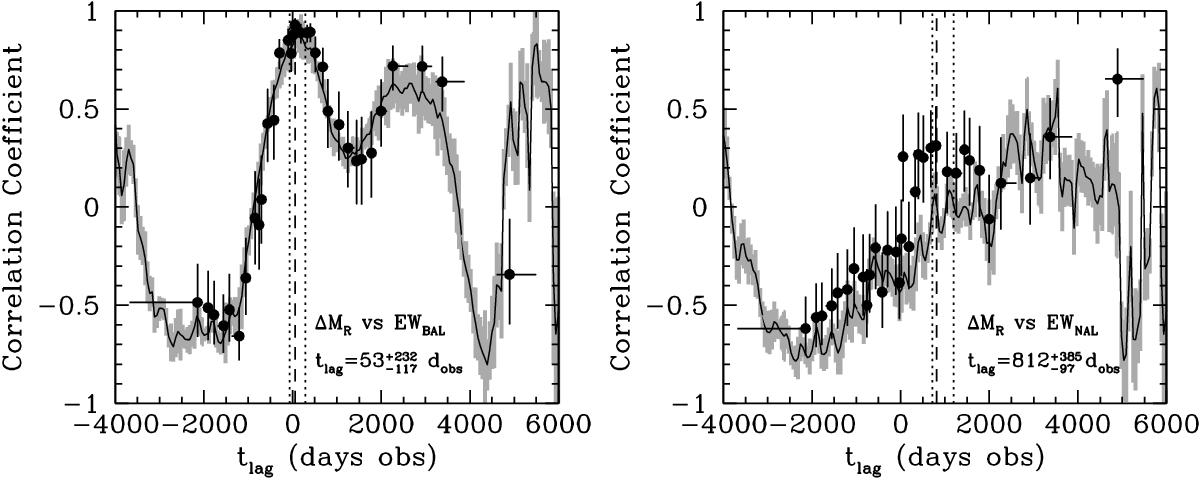
Left panel: cross-correlation function of the R-band magnitudes with the total C IV BAL EW tracing the continuum. Right panel: cross-correlation function of the R-band magnitudes with the total C IV “red” NAL EW. In both panels, both the ICCF (black solid line) with 1σ errors in the y direction (grey bars), and ZDCF computed with 15 points per bin (black points) with 1σ errors in both x and y directions, are shown. The dashed vertical lines indicate the delays of the most prominent peaks enclosed by their uncertainties at 68% probability (dotted lines), which are also numerically reported.
Current usage metrics show cumulative count of Article Views (full-text article views including HTML views, PDF and ePub downloads, according to the available data) and Abstracts Views on Vision4Press platform.
Data correspond to usage on the plateform after 2015. The current usage metrics is available 48-96 hours after online publication and is updated daily on week days.
Initial download of the metrics may take a while.