Fig. 7
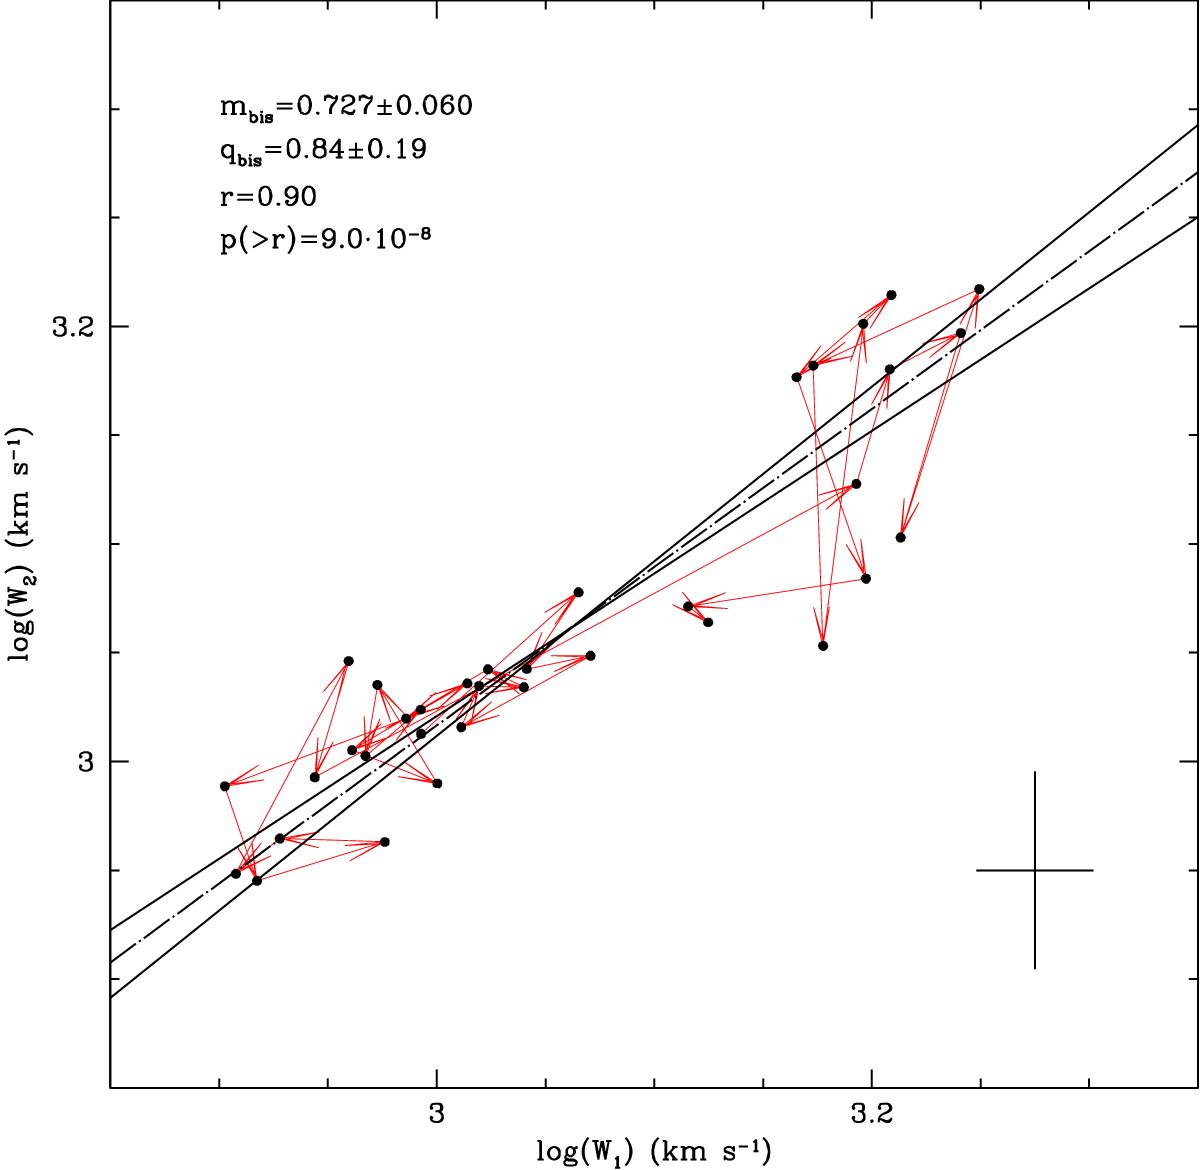
EWs of the two C IV BAL troughs of APM 08279+5255, plotted one versus the other (black points). The red arrows connect consecutive epochs of EW pairs. The two correlation fits of BAL1 versus BAL2 and vice versa are shown (solid lines) along with the corresponding bisector fit ( dot-dashed line). Slope mbis and intercept qbis of such fit, correlation coefficient r, and corresponding null-hypothesis probability p( >r) are reported. The cross in the lower right corner represents the mean error on the data set in each direction.
Current usage metrics show cumulative count of Article Views (full-text article views including HTML views, PDF and ePub downloads, according to the available data) and Abstracts Views on Vision4Press platform.
Data correspond to usage on the plateform after 2015. The current usage metrics is available 48-96 hours after online publication and is updated daily on week days.
Initial download of the metrics may take a while.