Fig. 6
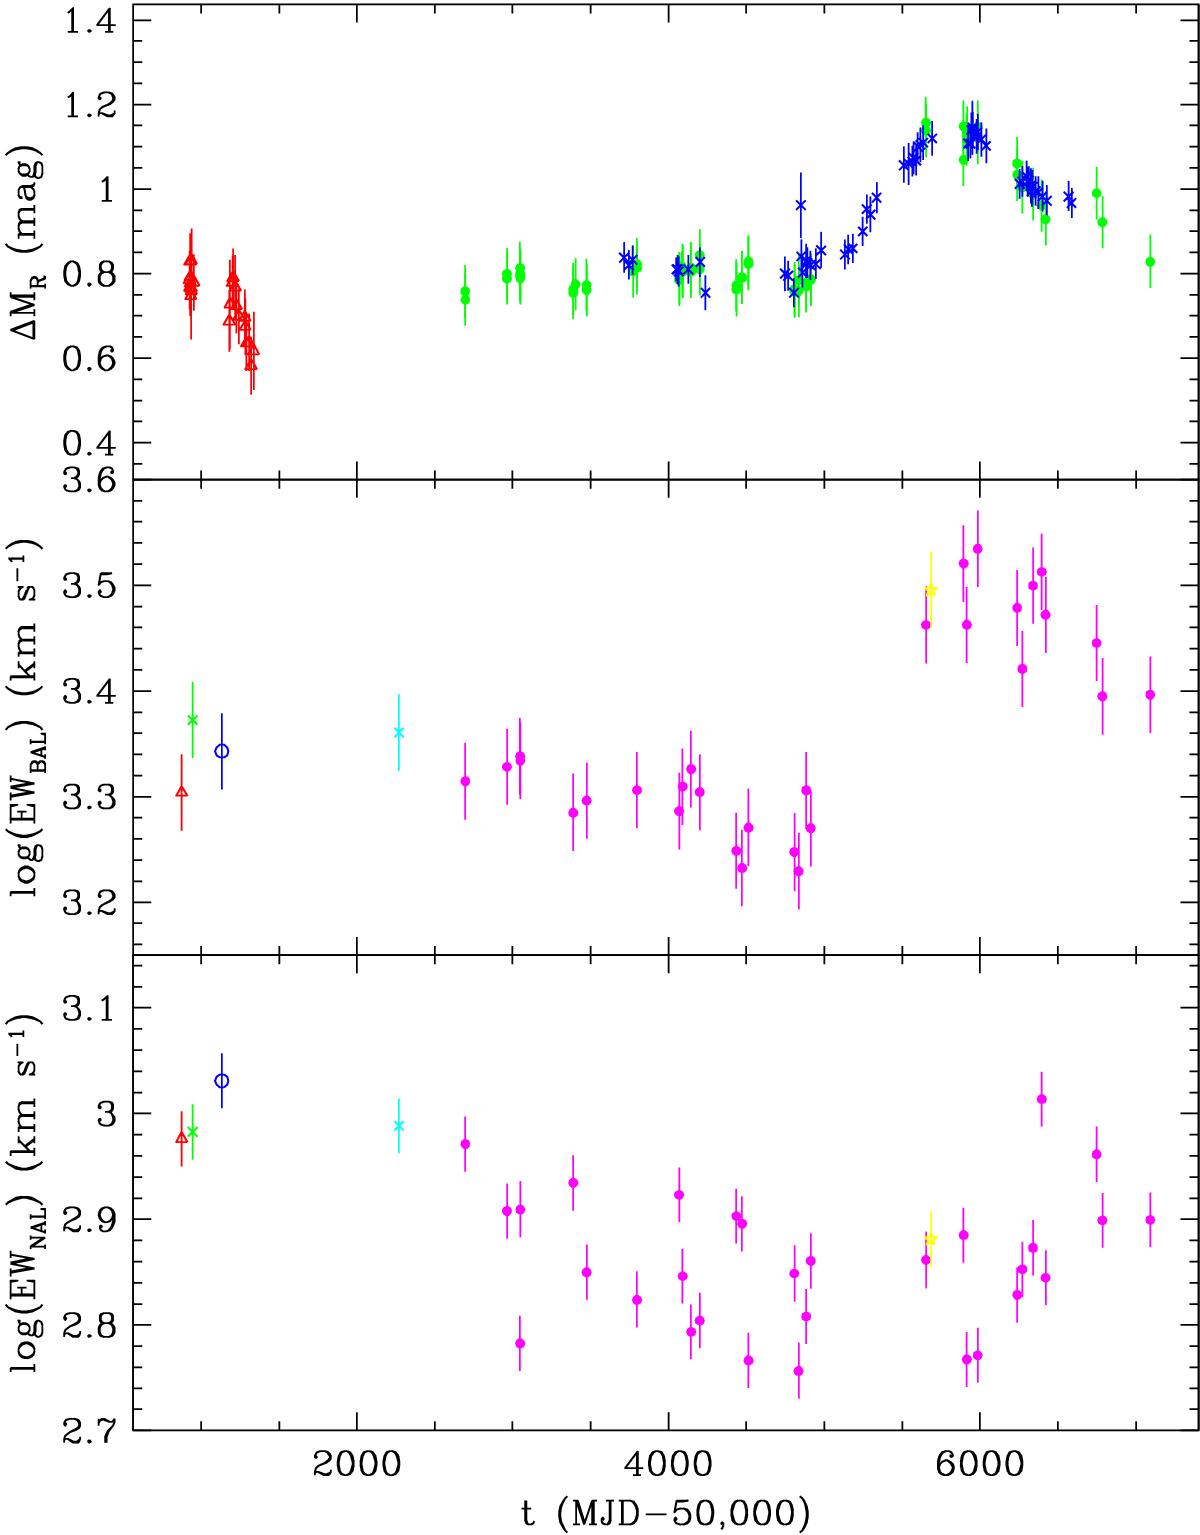
Upper panel: updated time series of APM 08279+5255 R-band differential magnitude with 1σ errors, adding all the photometric data available in literature (same colour code than in the upper panel of Fig. 2). Middle panel: BAL EWs computed for all the existing APM 08279+5255 spectra with 1σ errors. Lower panel: NAL EWs computed for all the existing APM 08279+5255 spectra with 1σ errors. In both middle and lower panels, Irwin et al. (1998; red triangle), Ellison et al. (1999; green cross), Hines et al. (1999; blue circle), Lewis et al. (2002; cyan square) and Saturni et al. (2015; yellow star) spectra are all included along with the Asiago and Loiano spectra (magenta dots).
Current usage metrics show cumulative count of Article Views (full-text article views including HTML views, PDF and ePub downloads, according to the available data) and Abstracts Views on Vision4Press platform.
Data correspond to usage on the plateform after 2015. The current usage metrics is available 48-96 hours after online publication and is updated daily on week days.
Initial download of the metrics may take a while.