Fig. 5
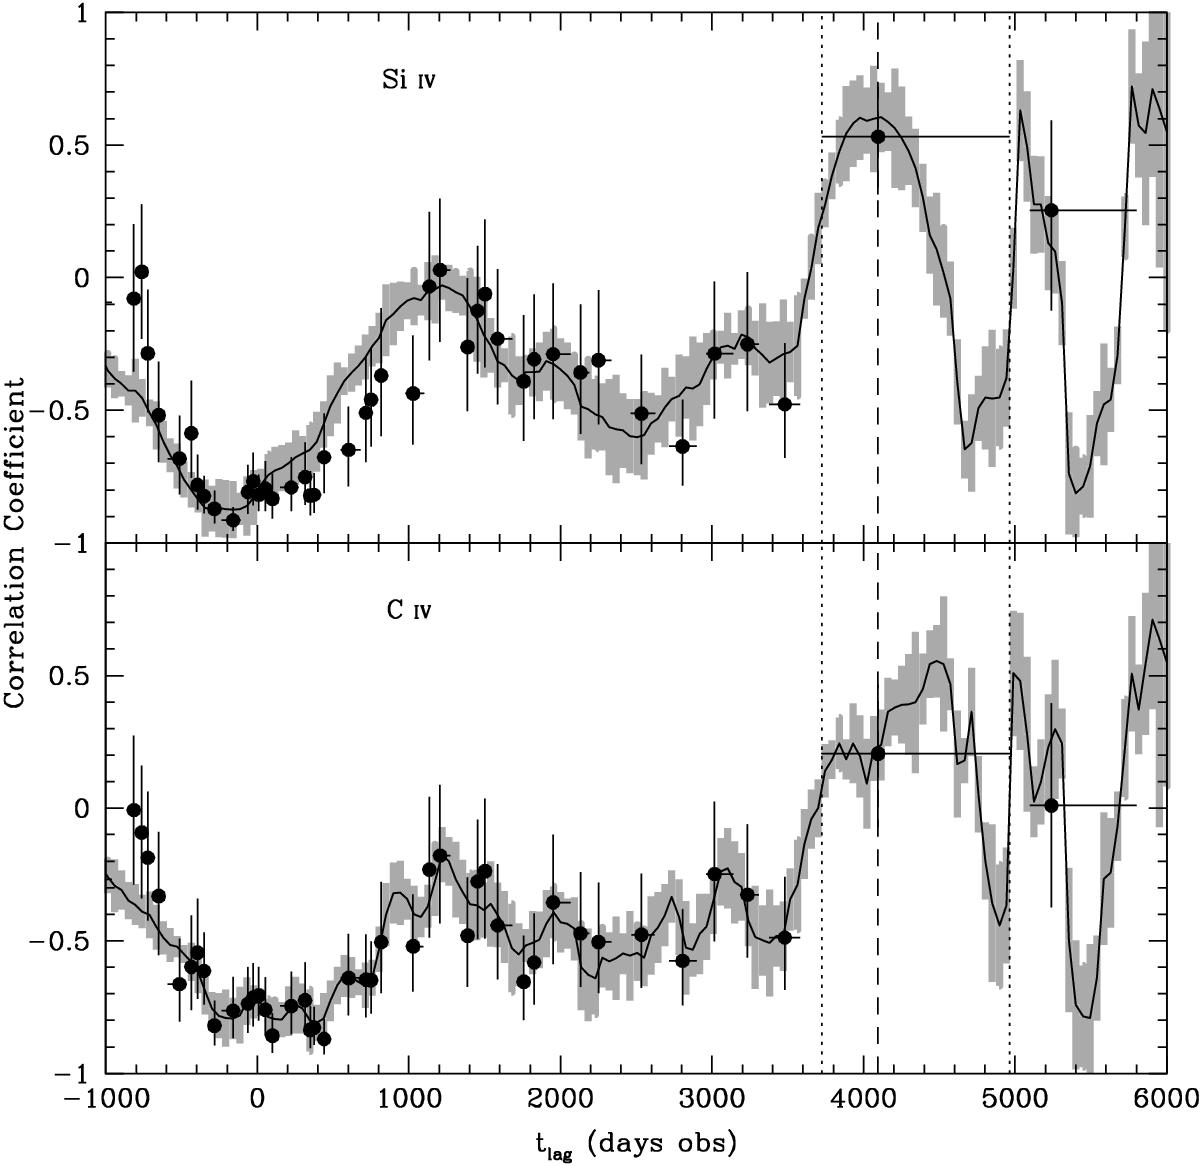
Upper panel: ICCF (solid line) with its 1σ error (grey area) and ZDCF (black points) for the continuum and the Si IV emission line. Lower panel: same as in the upper panel, but for the continuum and the C IV emission line. The ZDCF is computed over 15 uncorrelated points per bin, and finds a simultaneous peak for the two emission features at ![]() days in the observer frame that is indicated in the plot (dashed line and dotted lines).
days in the observer frame that is indicated in the plot (dashed line and dotted lines).
Current usage metrics show cumulative count of Article Views (full-text article views including HTML views, PDF and ePub downloads, according to the available data) and Abstracts Views on Vision4Press platform.
Data correspond to usage on the plateform after 2015. The current usage metrics is available 48-96 hours after online publication and is updated daily on week days.
Initial download of the metrics may take a while.