Fig. 4
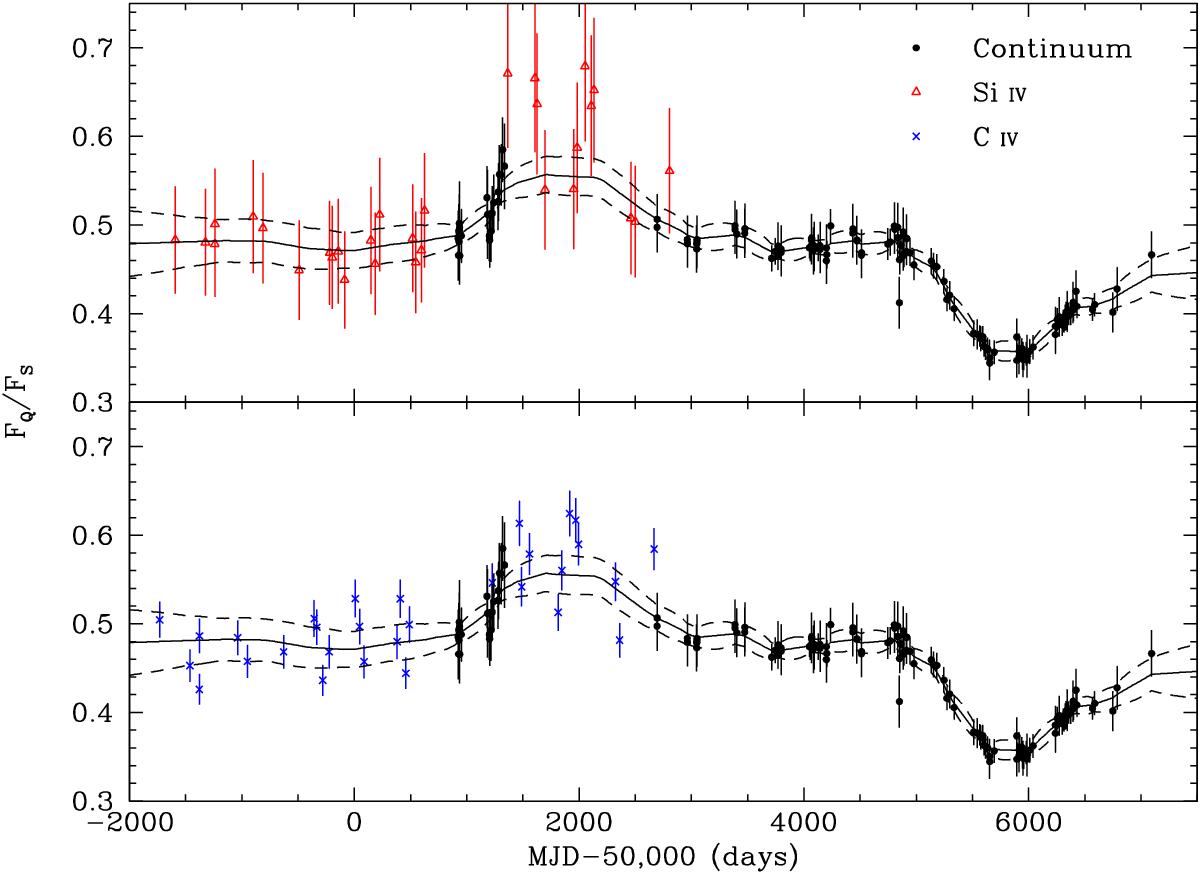
APM 08279+5255 light curve composed with the continuum (black dots) and emission-line fluxes, which are scaled in intensity and shifted in time of their JAVELIN lags of 837 and 901 rest-frame days, respectively, to mimic the original continuum light curve that is reverberated by the quasar BLR. Upper panel: continuum and Si IV (red triangles). Lower panel: continuum and C IV (blue crosses). In both panels, a DRW continuum, fitted by JAVELIN to the data with the damping timescale τd blocked to that of the continuum fit, is shown superimposed to the light curve (solid line) along with its 1σ error band (dashed lines).
Current usage metrics show cumulative count of Article Views (full-text article views including HTML views, PDF and ePub downloads, according to the available data) and Abstracts Views on Vision4Press platform.
Data correspond to usage on the plateform after 2015. The current usage metrics is available 48-96 hours after online publication and is updated daily on week days.
Initial download of the metrics may take a while.