Fig. 3
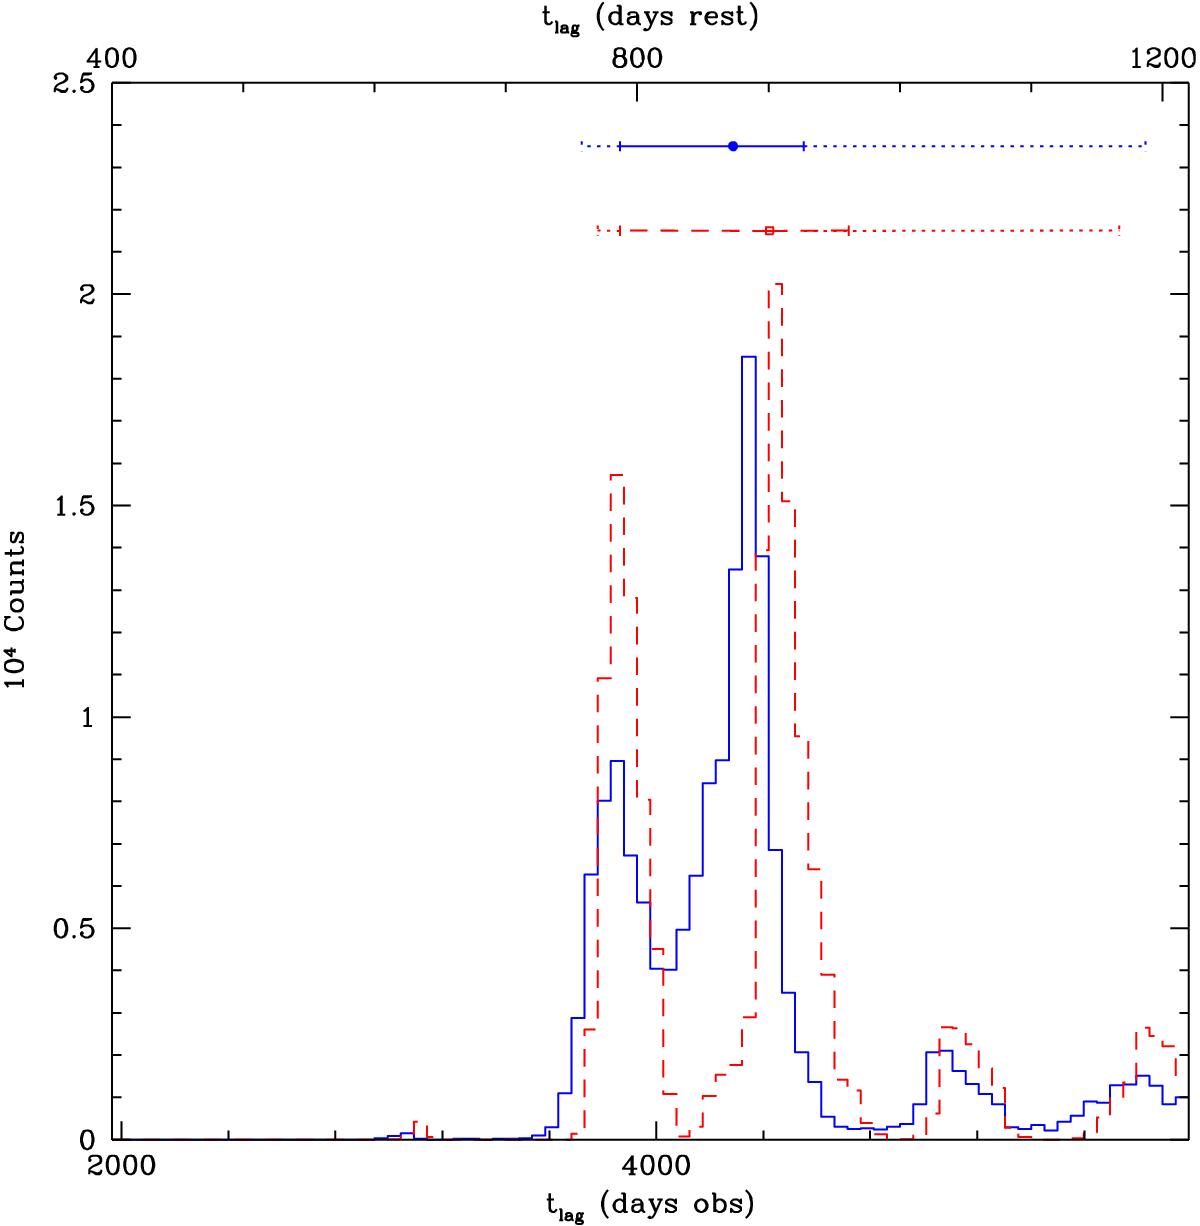
Posterior distributions of the Si IV (blue solid histogram) and C IV (red dashed histogram) RM time lags computed with JAVELIN. The time-lag mean values (blue point and red square) for each distribution are shown together with their corresponding confidence intervals at 68% (colour and line-type codes as per the histograms) and at 95% probability (dotted error bars).
Current usage metrics show cumulative count of Article Views (full-text article views including HTML views, PDF and ePub downloads, according to the available data) and Abstracts Views on Vision4Press platform.
Data correspond to usage on the plateform after 2015. The current usage metrics is available 48-96 hours after online publication and is updated daily on week days.
Initial download of the metrics may take a while.