Fig. 12
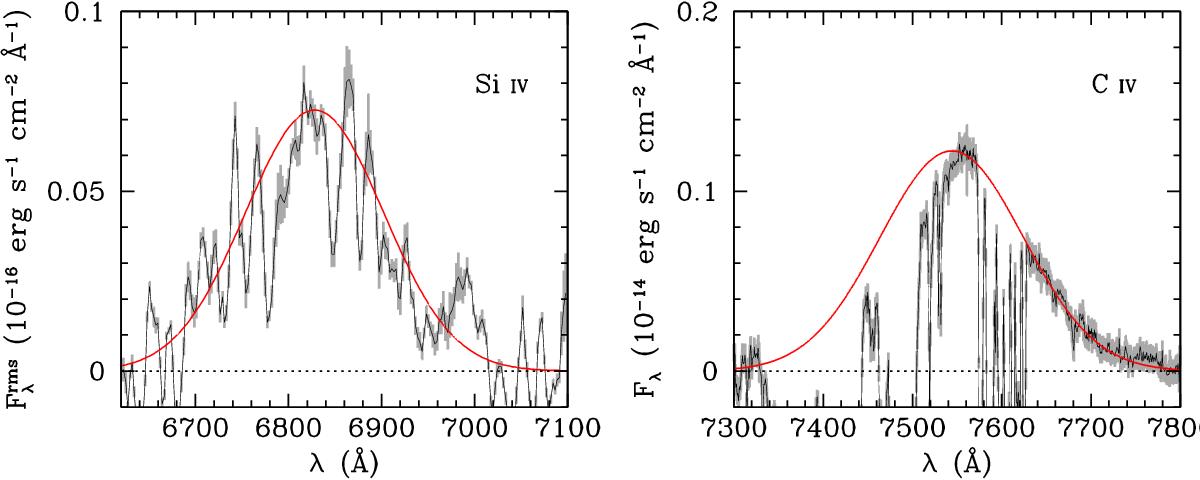
Left panel: continuum-subtracted rms spectrum of APM 08279+5255 Si IV emission line from our RM monitoring. Right panel: continuum-subtracted HST spectrum of the C IV emission line. In both panels, errors on the flux level (grey bars) and best-fit Gaussians (red curves) are shown. For Si IV, the major deviations from the best-fit curve are the residuals of intrinsic narrow absorptions superimposed to the emission line, as can be seen from the analysis by Srianand & Petitjean (2000) and Ellison et al. (2004).
Current usage metrics show cumulative count of Article Views (full-text article views including HTML views, PDF and ePub downloads, according to the available data) and Abstracts Views on Vision4Press platform.
Data correspond to usage on the plateform after 2015. The current usage metrics is available 48-96 hours after online publication and is updated daily on week days.
Initial download of the metrics may take a while.