Fig. 10
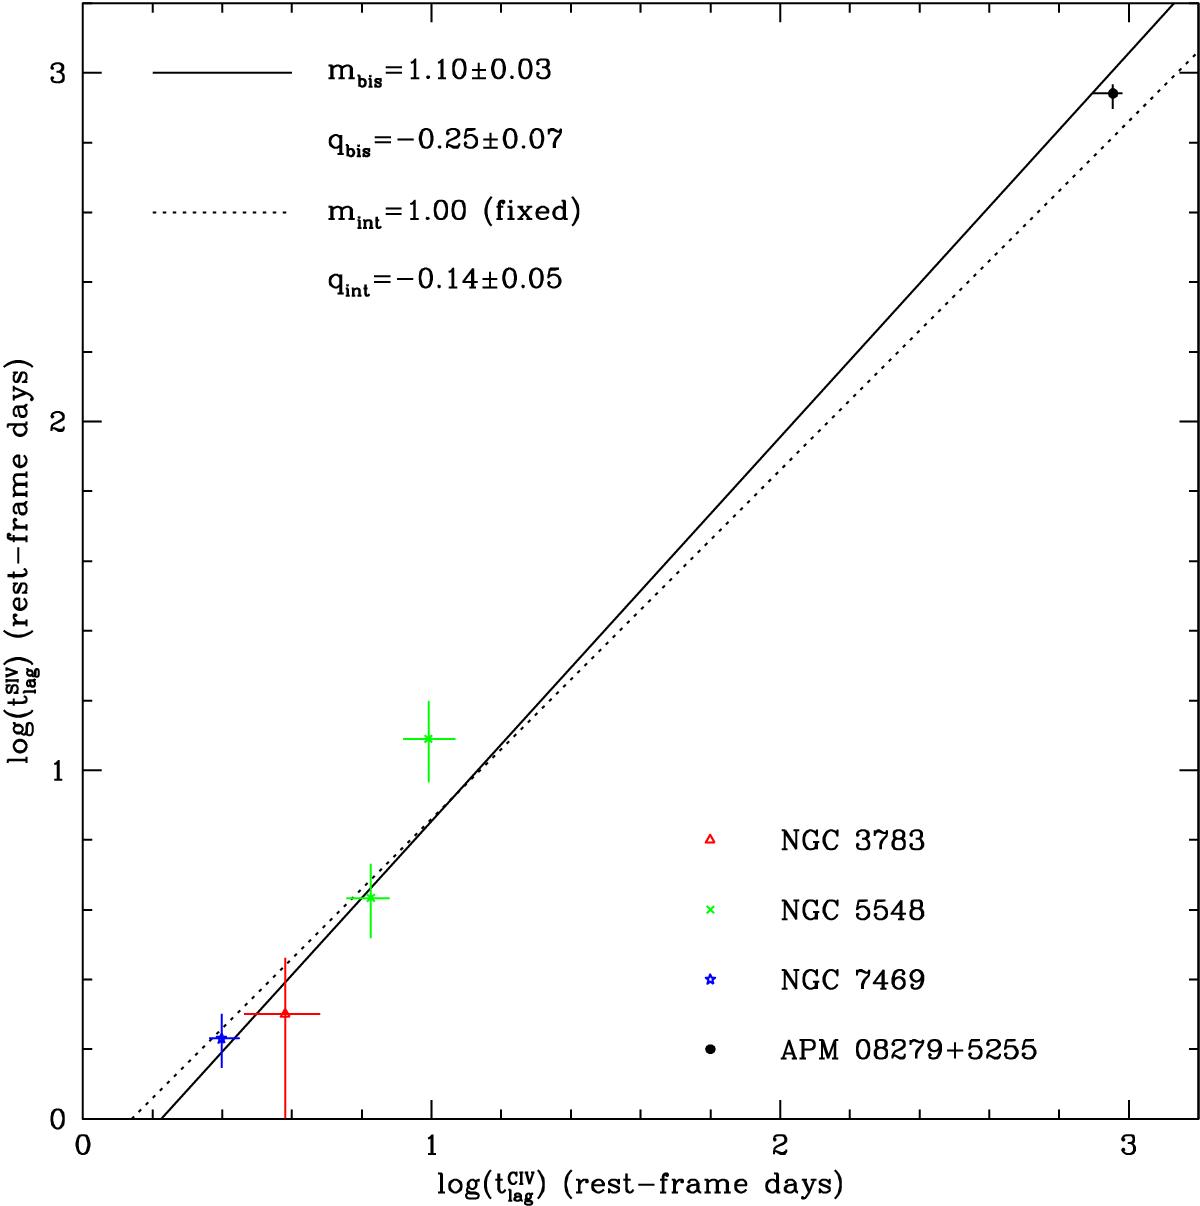
Rest-frame Si IV time lags as a function of C IV lags. All the available data from the literature are shown, together with our measurements from the RM of APM 08279+5255 (legend is on the plot). We performed a free linear fit in the logarithmic space (solid line) and a linear fit with logarithmic slope fixed to unity (dotted line) for the whole data set. Fit coefficients are indicated in the plot with their 1σ errors.
Current usage metrics show cumulative count of Article Views (full-text article views including HTML views, PDF and ePub downloads, according to the available data) and Abstracts Views on Vision4Press platform.
Data correspond to usage on the plateform after 2015. The current usage metrics is available 48-96 hours after online publication and is updated daily on week days.
Initial download of the metrics may take a while.