Fig. 2
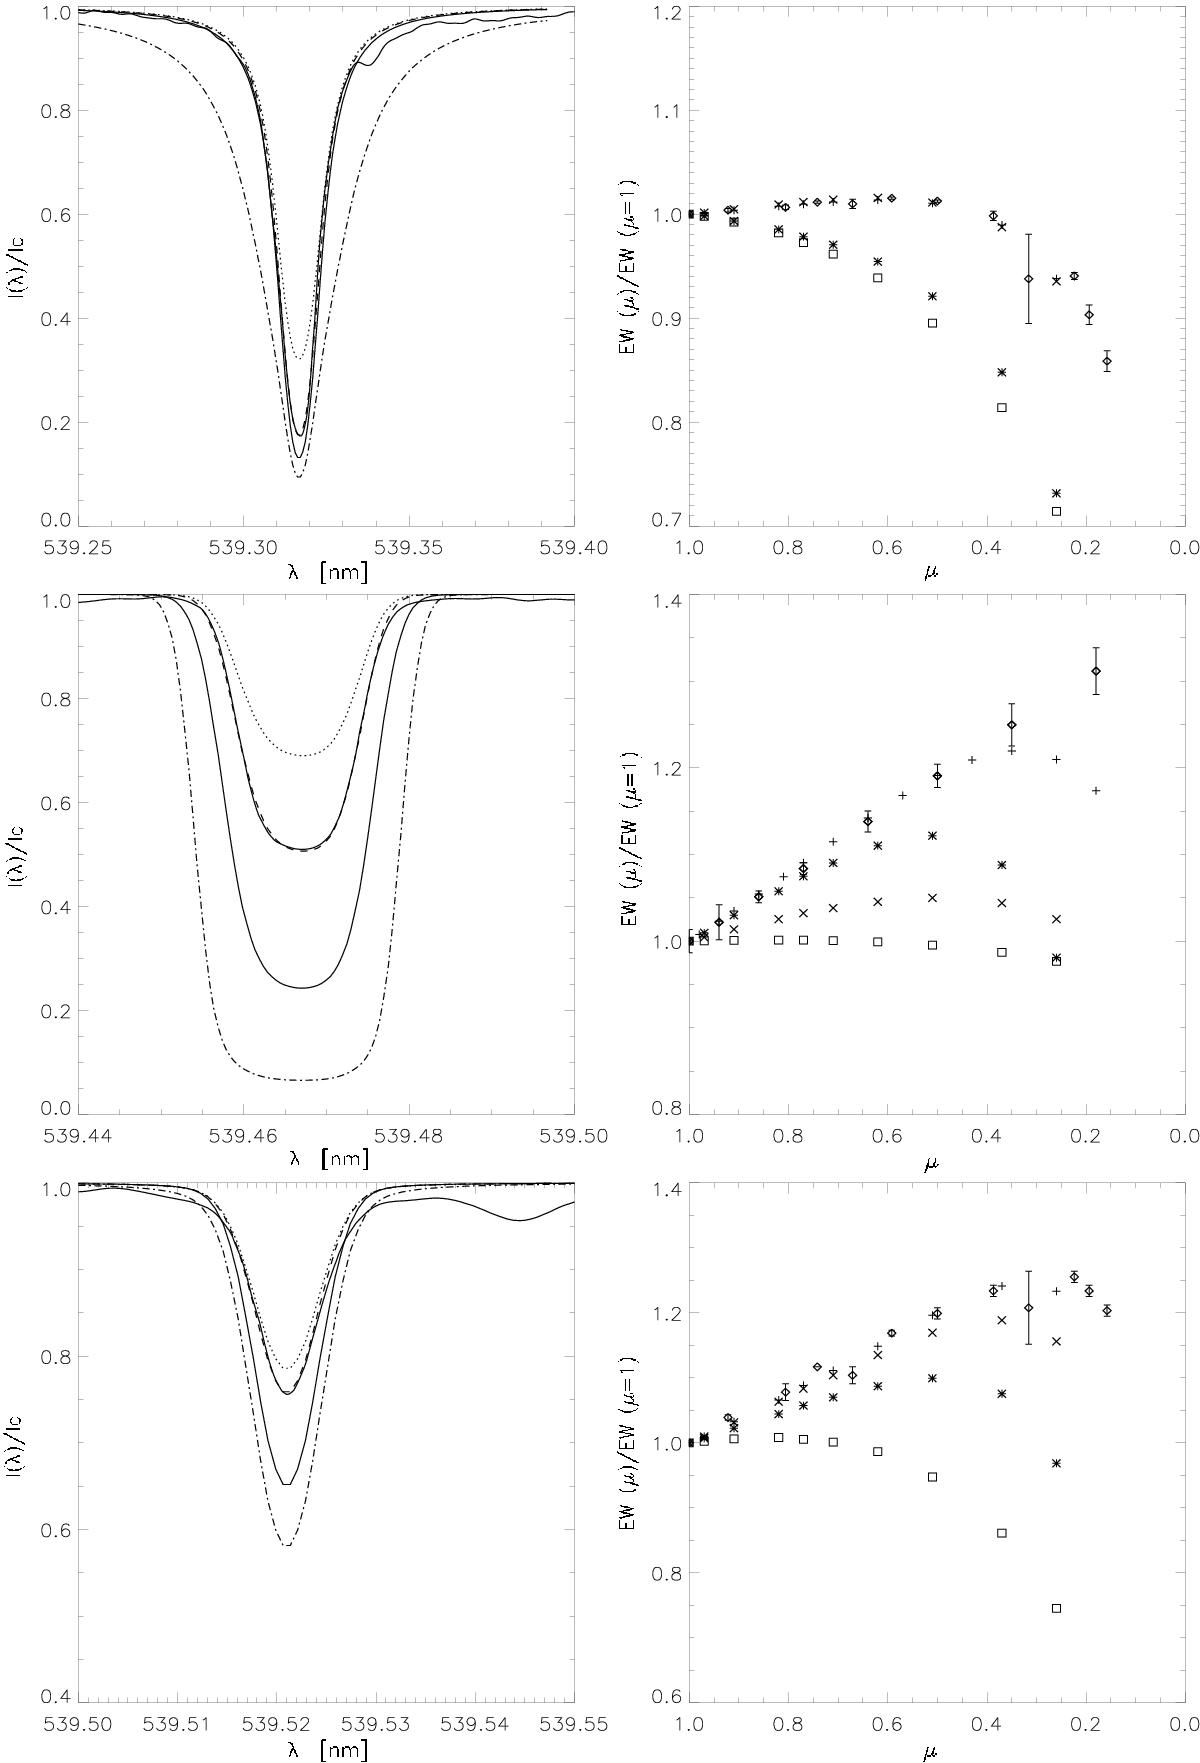
Left-hand side: profiles of Fe i 539.32 nm, Mn i 539.47 nm, and Fe i 539.52 nm lines at the disk center, from top to bottom. The profiles are computed in the following model atmospheres: quiet Sun (dashed), faculae (dotted), penumbrae (double-dot-dashed), and umbrae (dash-dotted). FTS atlas profiles are overplotted (solid curves). Right-hand side: center-to-limb variation of the EW of the lines. Symbols distinguish between the EW resulting from different model atmospheres: quiet Sun (plus signs), faculae (asterisks), penumbrae (crosses), and umbrae (squares). Diamonds with error bars are values observed in the quiet Sun.
Current usage metrics show cumulative count of Article Views (full-text article views including HTML views, PDF and ePub downloads, according to the available data) and Abstracts Views on Vision4Press platform.
Data correspond to usage on the plateform after 2015. The current usage metrics is available 48-96 hours after online publication and is updated daily on week days.
Initial download of the metrics may take a while.