Free Access
Fig. 1
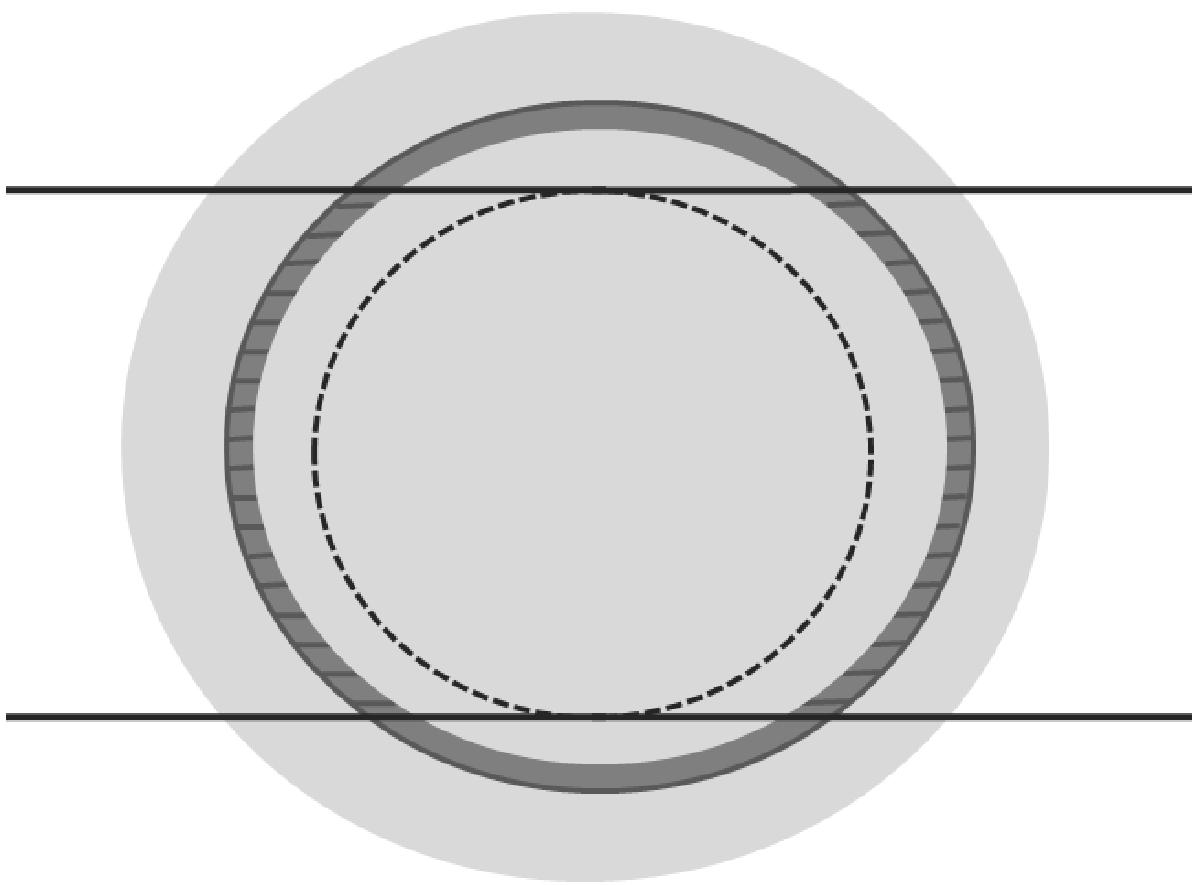
Illustration of flux calculations for the period before 1993 when the old grating was used. The two horizontal lines delimit the part of the disk that illuminates the grating. The dashed circle corresponds to μ = μcut.
Current usage metrics show cumulative count of Article Views (full-text article views including HTML views, PDF and ePub downloads, according to the available data) and Abstracts Views on Vision4Press platform.
Data correspond to usage on the plateform after 2015. The current usage metrics is available 48-96 hours after online publication and is updated daily on week days.
Initial download of the metrics may take a while.