Fig. 23
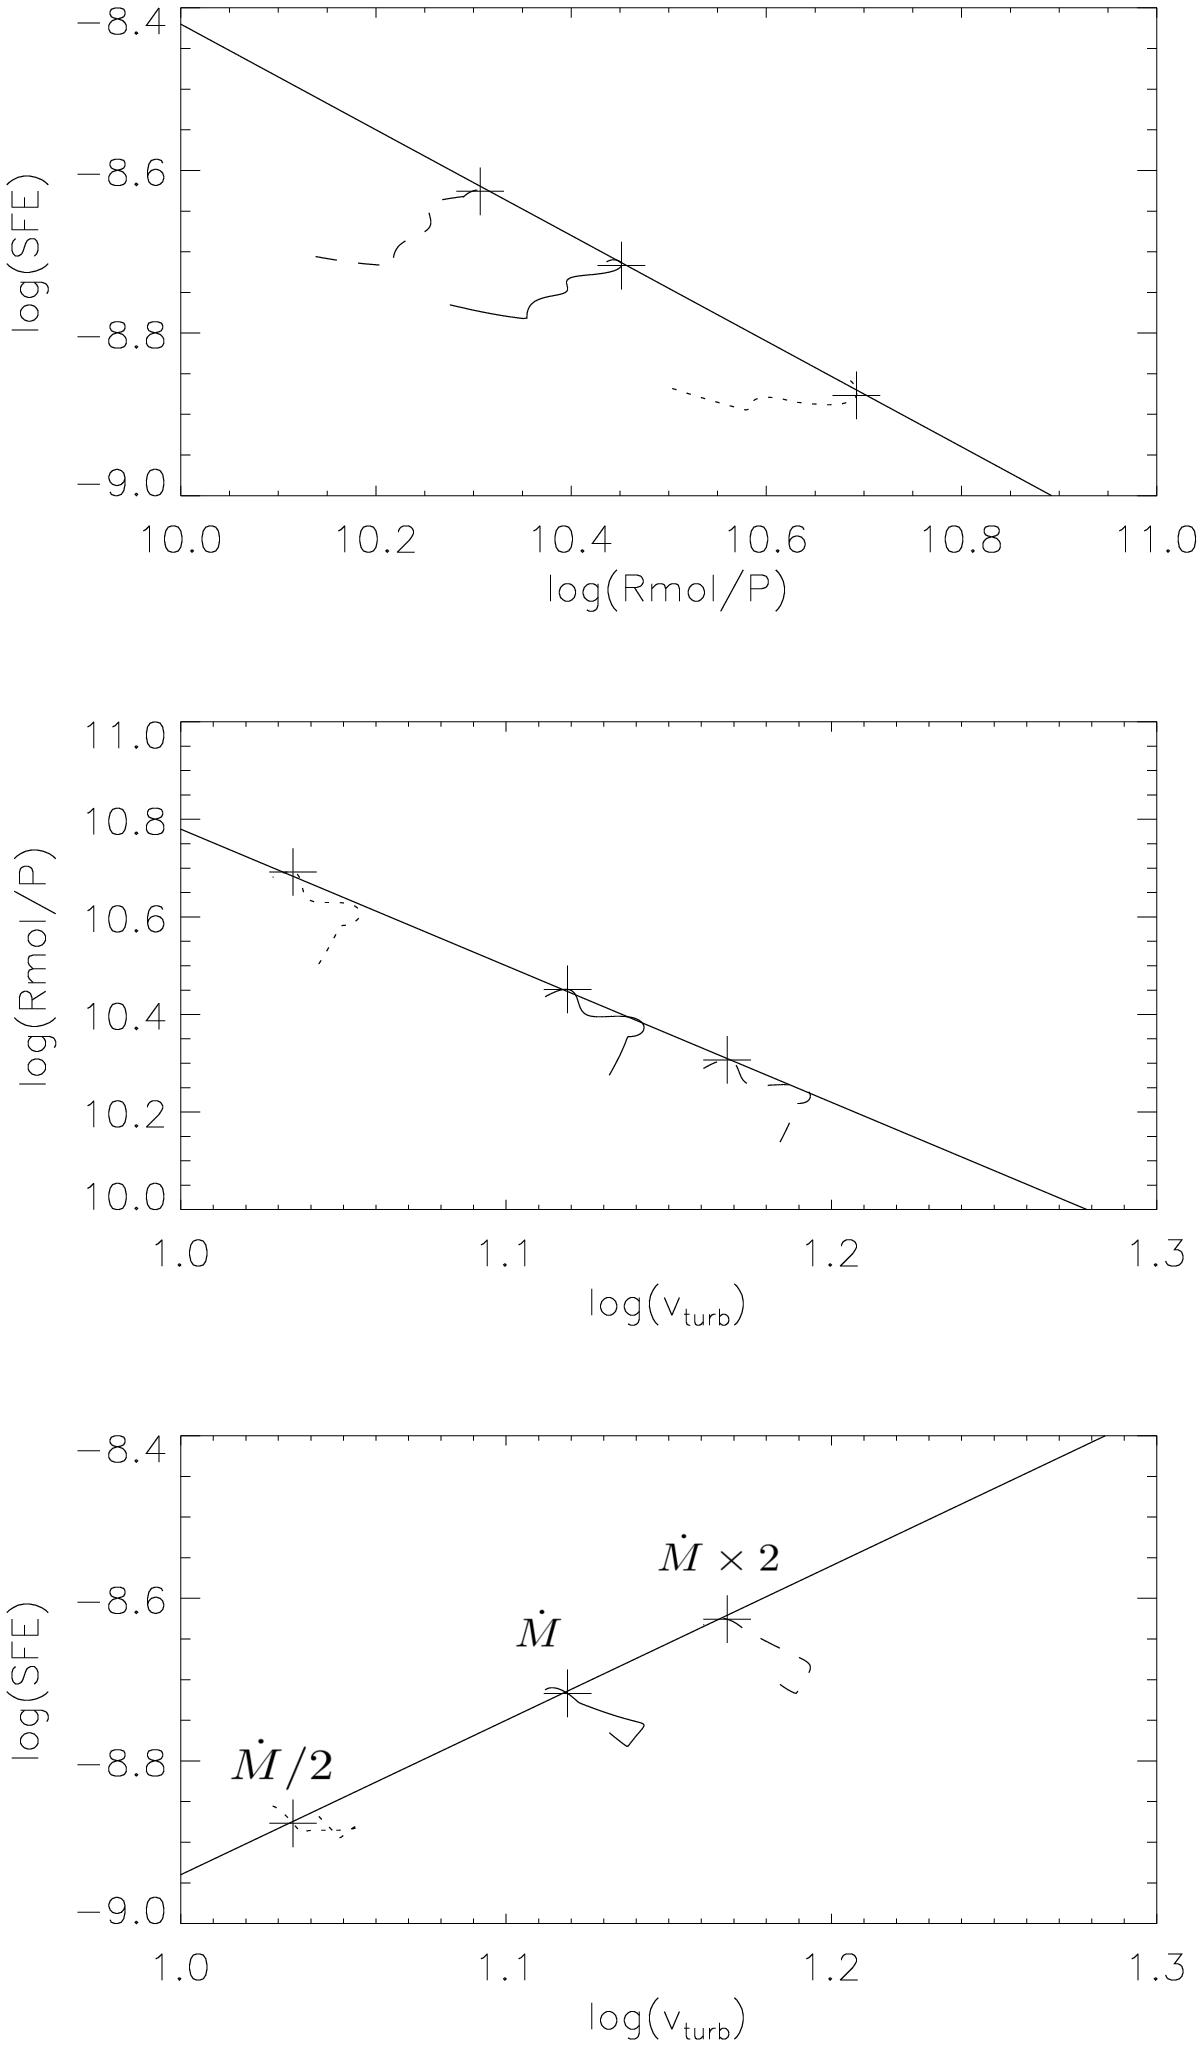
Analytical model. Top panel: molecular SFEH2 as a function of Rmol/Ptot for different mass accretion rates. The solid line corresponds to y = −0.65x + 1.92. Middle panel: Rmol/Ptot as a function of the turbulent velocity. The solid line corresponds to y = −2.8x + 13.58. Lower panel: SFEH2 as a function of the turbulent velocity. The solid line corresponds to y = 1.9x + 10.84.
Current usage metrics show cumulative count of Article Views (full-text article views including HTML views, PDF and ePub downloads, according to the available data) and Abstracts Views on Vision4Press platform.
Data correspond to usage on the plateform after 2015. The current usage metrics is available 48-96 hours after online publication and is updated daily on week days.
Initial download of the metrics may take a while.