Fig. 1
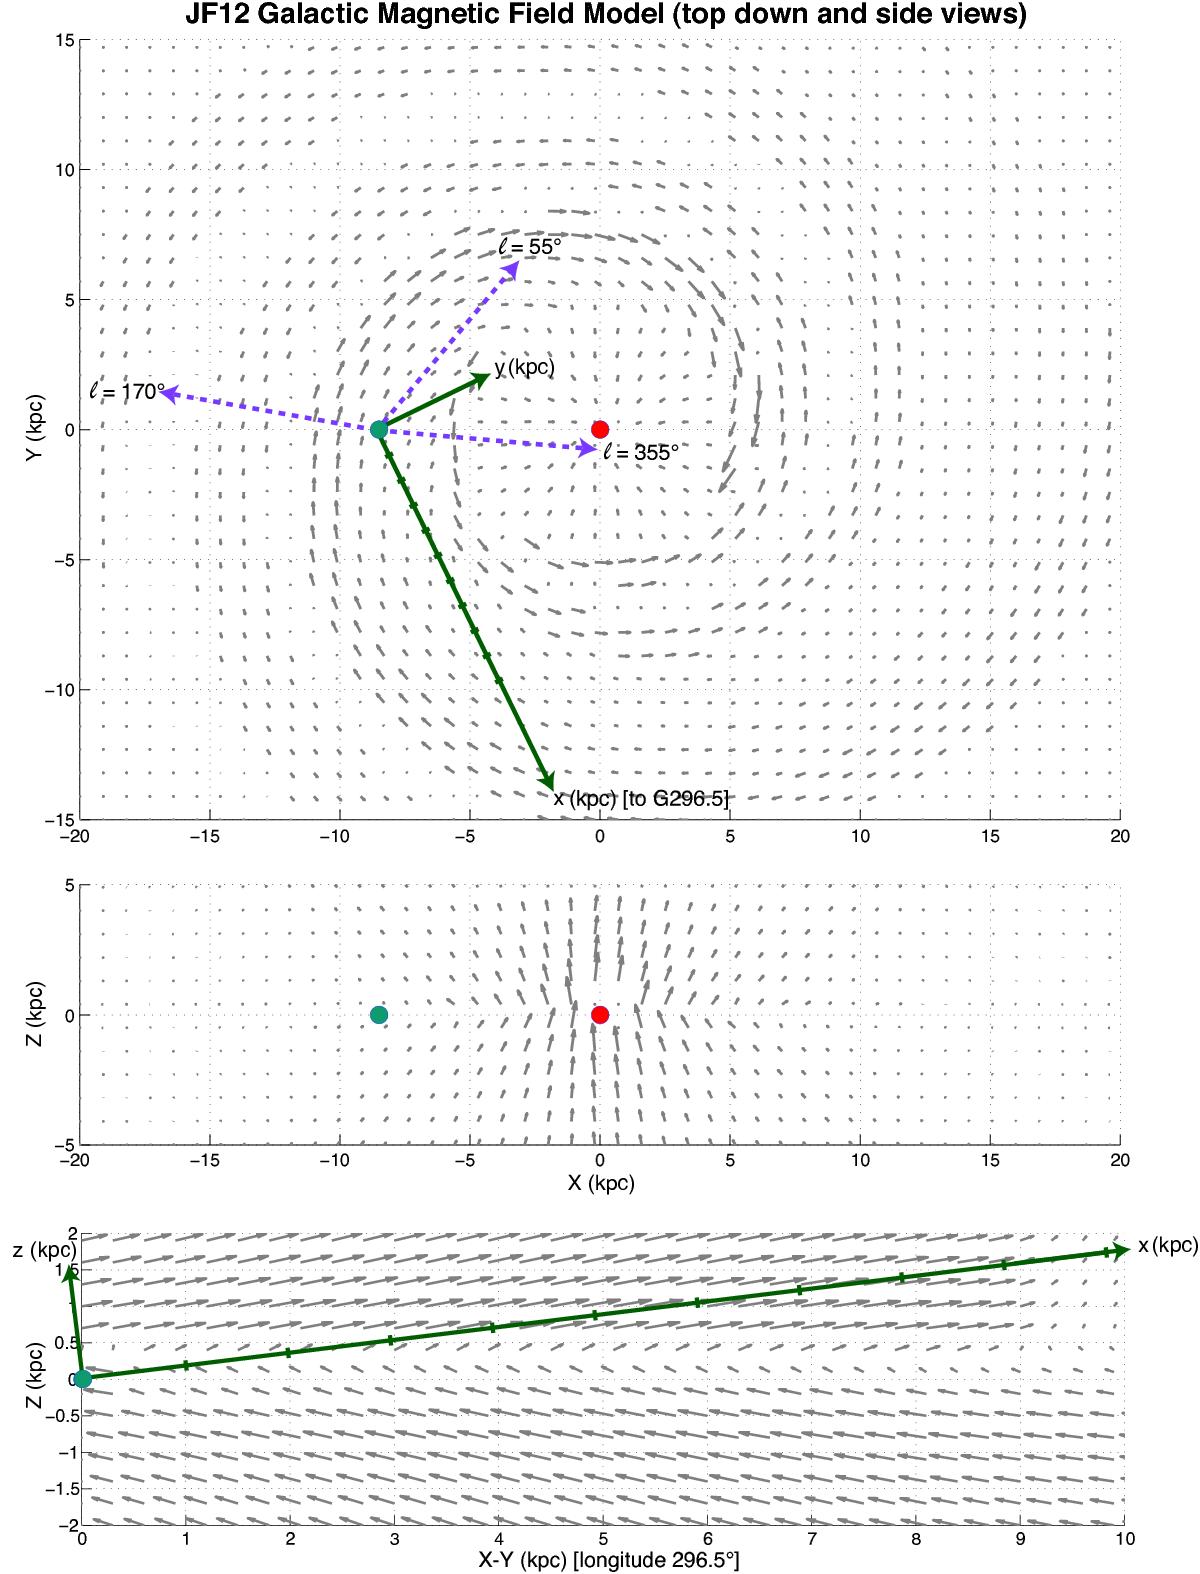
Plots of the magnetic field from JF12. Top panel: top view of the X–Y plane of the Galaxy cut through Z = 0. The green arrows show the x–y coordinate system for SNR G296.5+10.0. The dashes on the x-axis are marked at 1 kpc intervals. The purple, dashed arrows show other longitudes, l = 55°, where the GMF is primarily along the line of sight and l = 170° and l = 355°, where the GMF is primarily perpendicular to the line of sight. The filled, red circle marks the Galactic center and the filled, green circle marks the position of the Sun. Center panel: X–Z plane cut through Y = 0. As in the top panel, the filled, red circle marks the Galactic center and the filled, green circle marks the position of the Sun. The shape of the X-field can be seen. Bottom panel: GMF lines are shown as cut along l = 296.5°. Here the horizontal axis of this plot is in the X–Y plane of the Galaxy along l = 296.5°. The vertical axis of this plot shows the z-axis of the Galaxy. As in the top panel, the green arrows show the primed coordinate system, in this case the x–z coordinates, for the case of SNR G296.5+10.0, which has b = 10.0°. The dashes on the x-axis are marked at 1 kpc intervals as in the top panel. Here, one can see that for d = 1 kpc, the GMF vectors are nearly pointed along the z-axis.
Current usage metrics show cumulative count of Article Views (full-text article views including HTML views, PDF and ePub downloads, according to the available data) and Abstracts Views on Vision4Press platform.
Data correspond to usage on the plateform after 2015. The current usage metrics is available 48-96 hours after online publication and is updated daily on week days.
Initial download of the metrics may take a while.