Fig. 6
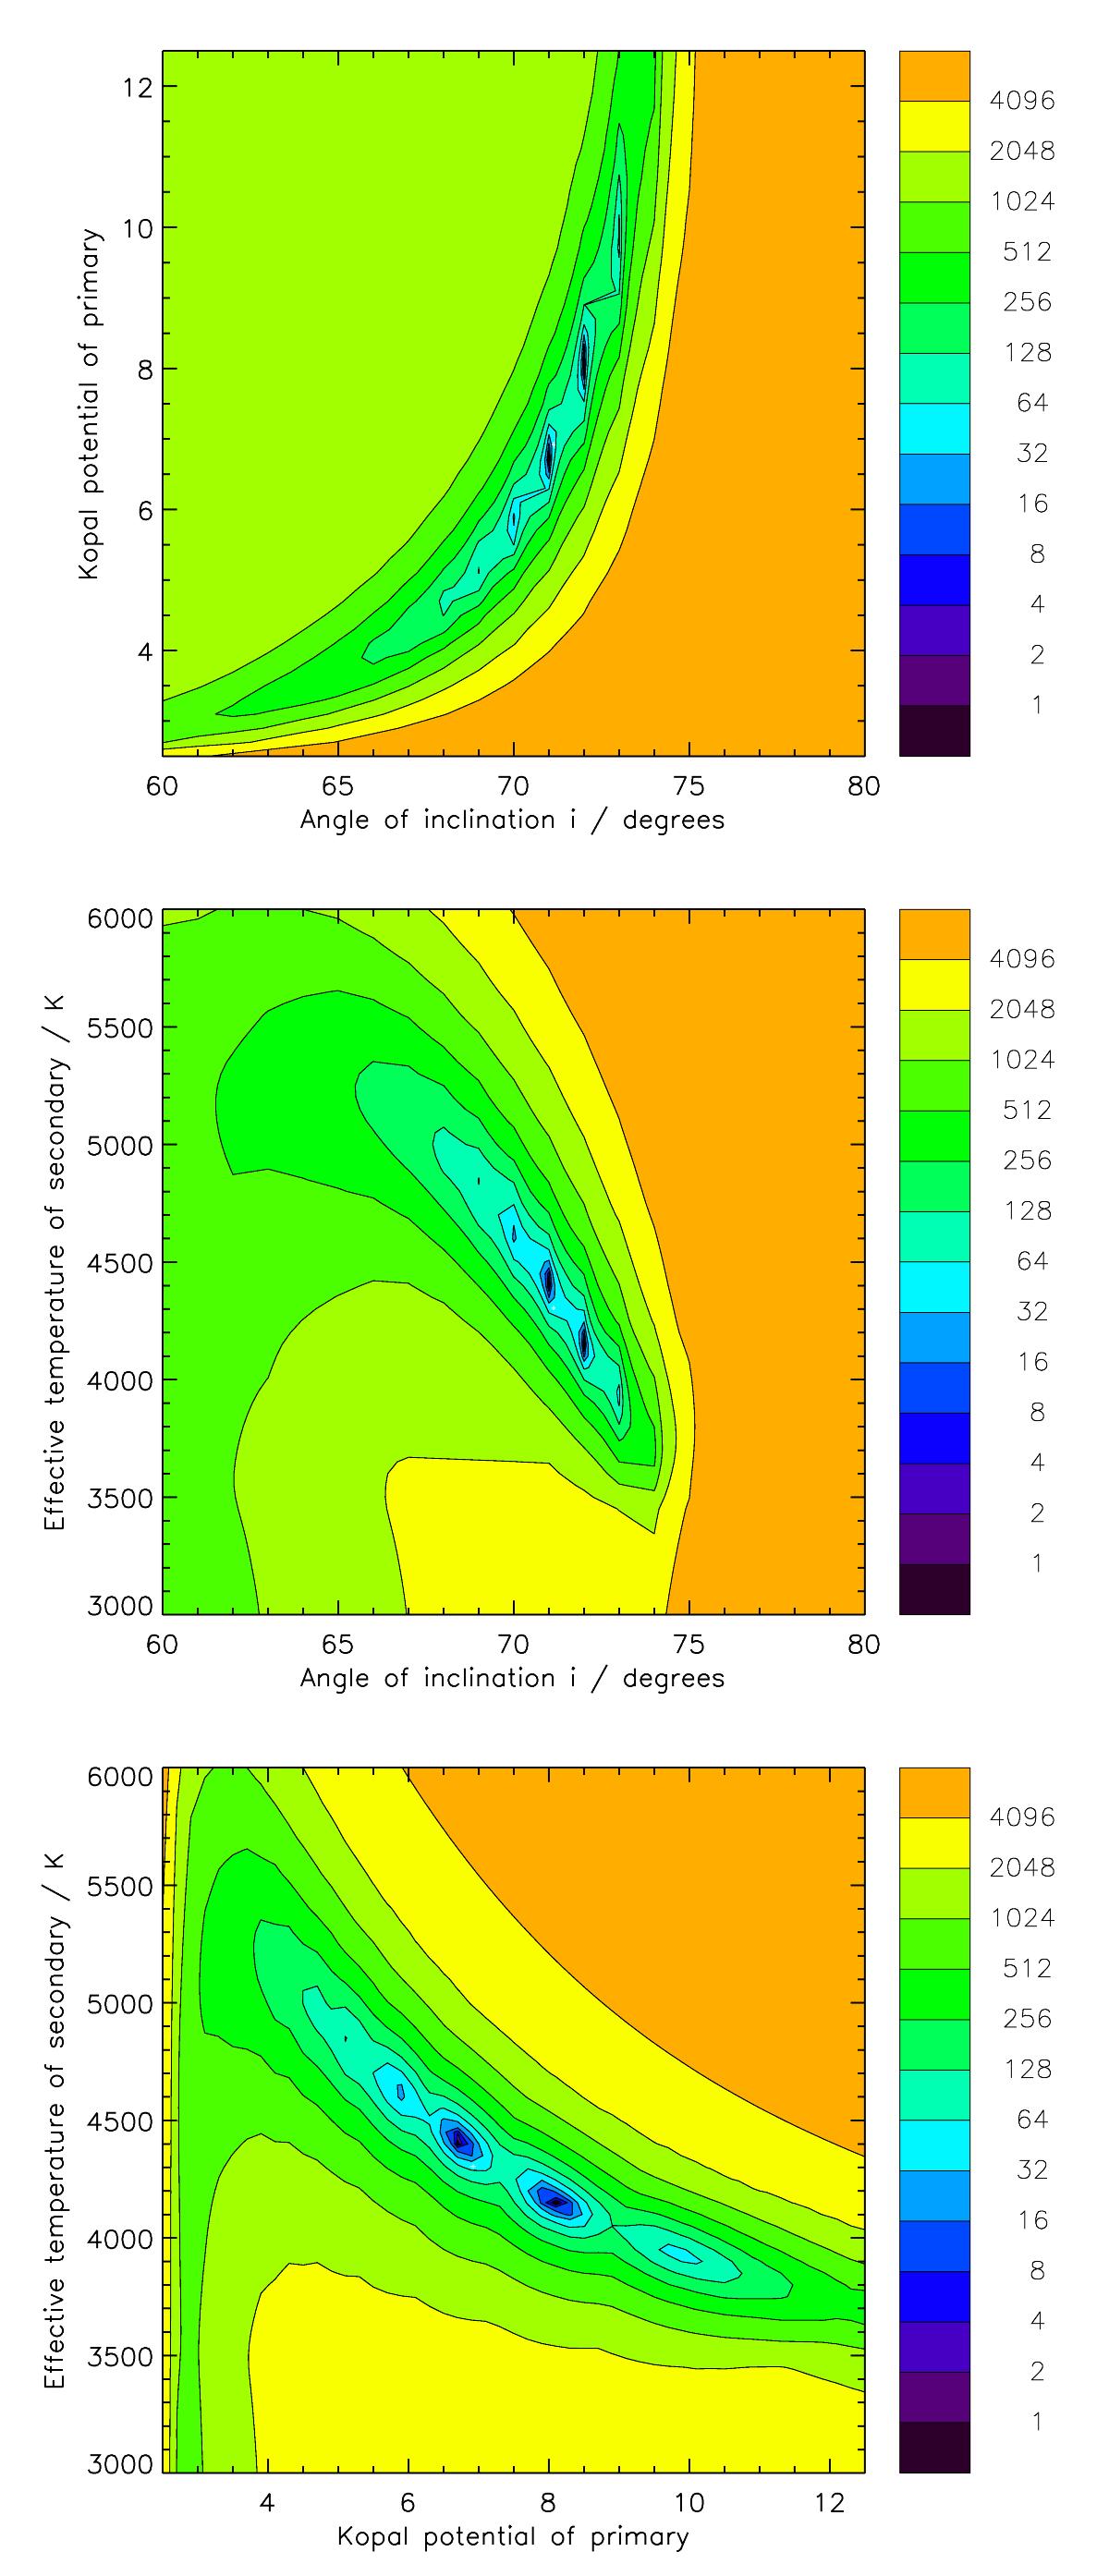
Joint confidence levels for pairs of parameter values (i, T2, and Ω1 in various combinations) obtained from a series of heuristic scans over a grid around the best fit region. Darker colours correspond to better fits, as indicated by the colour bar; the numerical values represent the number of standard deviations away from the best-fit value.
Current usage metrics show cumulative count of Article Views (full-text article views including HTML views, PDF and ePub downloads, according to the available data) and Abstracts Views on Vision4Press platform.
Data correspond to usage on the plateform after 2015. The current usage metrics is available 48-96 hours after online publication and is updated daily on week days.
Initial download of the metrics may take a while.