Fig. 3
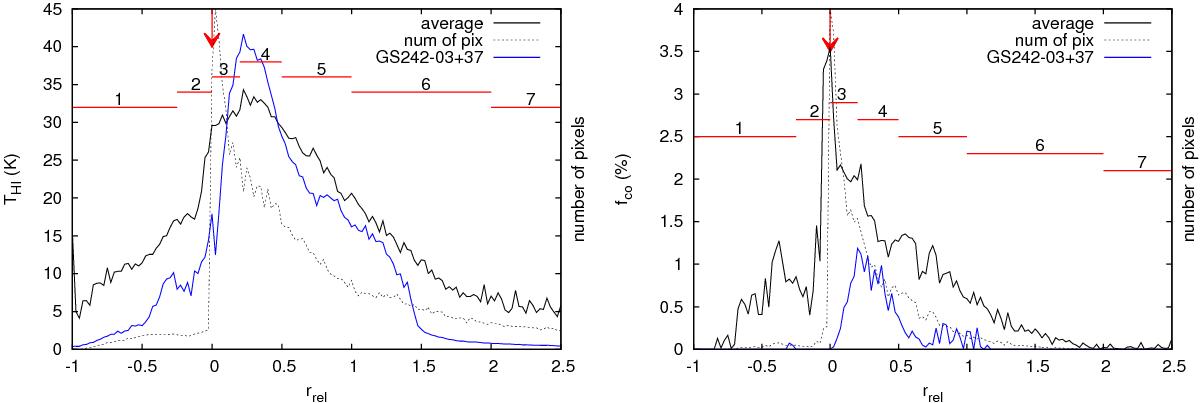
Average HI temperature (left) and CO filling factor (right) as a function of the relative distance rrel. Black solid line shows the average for the whole datacube, blue solid line shows the profile for one Galactic HI supershell, GS242-03+37. Dotted lines show the number of pixels, from which the average was calculated. Red lines with numbers give extents of different “types of environment”. Red arrows indicate the transition between bubbles and walls.
Current usage metrics show cumulative count of Article Views (full-text article views including HTML views, PDF and ePub downloads, according to the available data) and Abstracts Views on Vision4Press platform.
Data correspond to usage on the plateform after 2015. The current usage metrics is available 48-96 hours after online publication and is updated daily on week days.
Initial download of the metrics may take a while.