Fig. 4
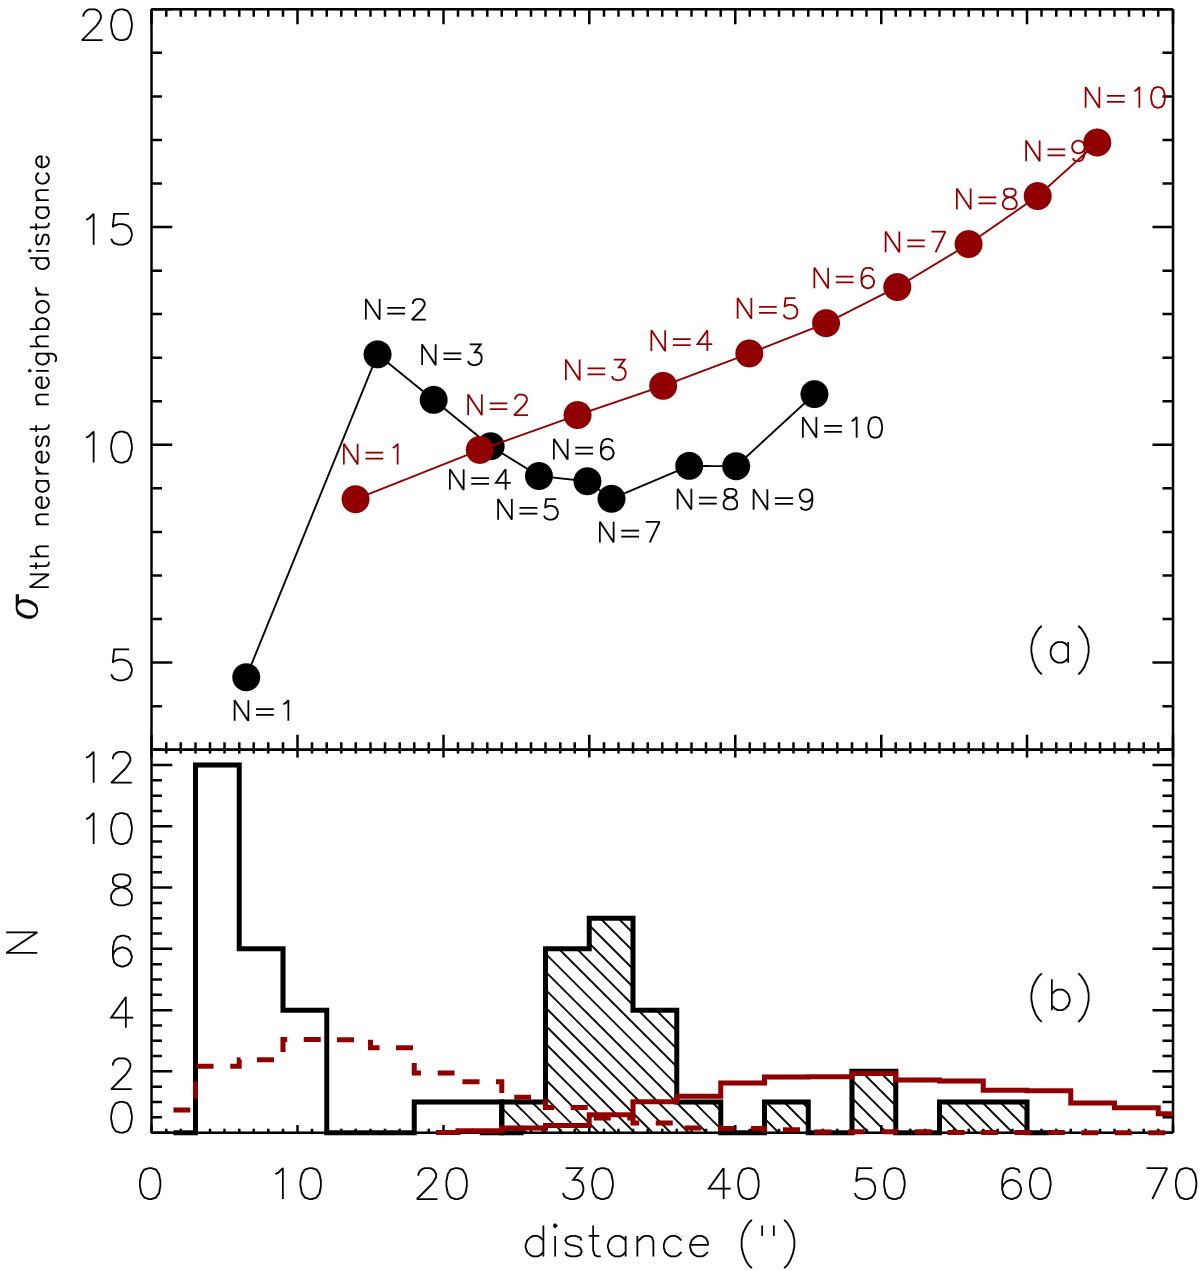
a) Median nth nearest-neighbor separations of the SMA sources vs. σNth NNS, where each data point (black filled symbol) is labeled from N = 1,..., 10.The red symbols represent the median nth NNS for a random spatial distribution for comparison purposes (see text). b) Distribution of the first NNS (open black histogram) and the distribution of the seventh NNS (filled black histogram). The red dashed-line and the red solid-line histograms correspond to the first and seventh NNS for random spatial distributions, respectively. All the histogram bin widths correspond to the approximate SMA synthesized beam size, 3′′.
Current usage metrics show cumulative count of Article Views (full-text article views including HTML views, PDF and ePub downloads, according to the available data) and Abstracts Views on Vision4Press platform.
Data correspond to usage on the plateform after 2015. The current usage metrics is available 48-96 hours after online publication and is updated daily on week days.
Initial download of the metrics may take a while.