Fig. 3
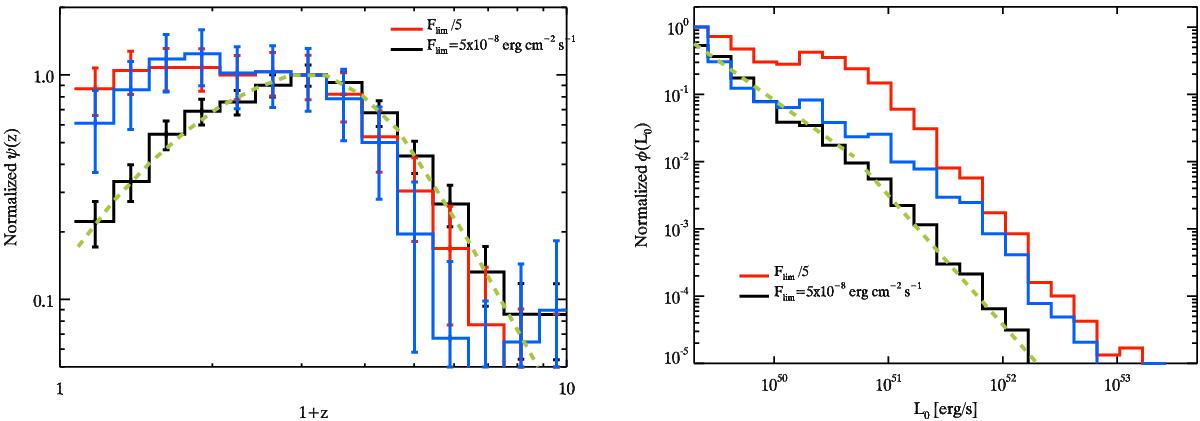
Left panel: GRB-formation rate (normalised to its peak) for the simulated population of GRBs with flux limit 5 × 10⁻⁸ erg cm-2 s-1 (black symbols). The GRB-formation rate assumed in the simulation is shown by the dashed green line. The red symbols show the results obtained from the same sample using, for the analysis, a flux limit factor of 5 smaller than the real one. Blue symbols are obtained by mimicking the sample incompleteness by removing some GRBs randomly near the flux threshold adopted for the sample selection. Right panel: cumulative luminosity function, normalised to the first bin. The black, red, and blue symbols are the same as for the left panel. The assumed luminosity function is shown by the dashed green line.
Current usage metrics show cumulative count of Article Views (full-text article views including HTML views, PDF and ePub downloads, according to the available data) and Abstracts Views on Vision4Press platform.
Data correspond to usage on the plateform after 2015. The current usage metrics is available 48-96 hours after online publication and is updated daily on week days.
Initial download of the metrics may take a while.