Free Access
Fig. 2
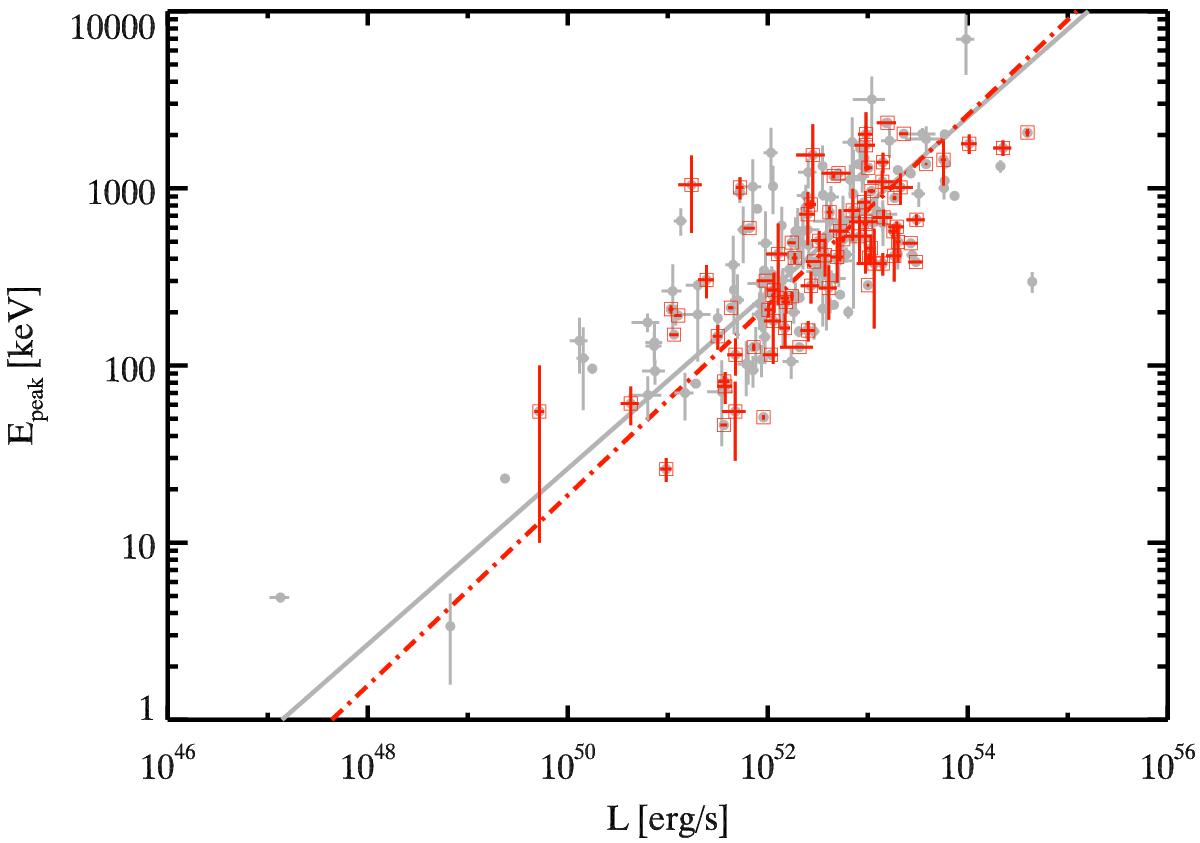
Ep−L correlation. Grey points and the red empty squares represent the total and BAT6ext complete sample. The solid gray line and the dot-dashed line are the best-fit (obtained with the bisector method applied in the barycentre of points) results for the total and BAT6ext complete sample respectively.
Current usage metrics show cumulative count of Article Views (full-text article views including HTML views, PDF and ePub downloads, according to the available data) and Abstracts Views on Vision4Press platform.
Data correspond to usage on the plateform after 2015. The current usage metrics is available 48-96 hours after online publication and is updated daily on week days.
Initial download of the metrics may take a while.