Fig. 1
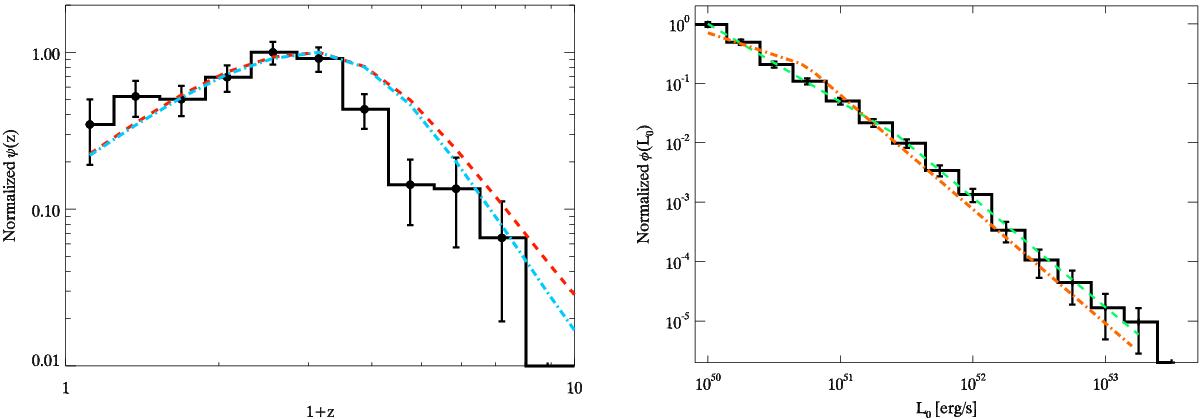
Left panel: GRB formation rate ψ(z) obtained with the C− method using the BAT6ext sample (black solid line). The dashed red line and the dot-dashed cyan line are the SFR models of Hopkins & Beacom (2006) and Cole et al. (2001) shown here for reference. All the curves are normalised to their maxima. Right panel: luminosity function φ(L0) obtained with the C− method using the BAT6ext sample (black solid line). The best fit model describing this function is a broken power-law (dashed green line) with (a = −1.32 ± 0.21, b = −1.84 ± 0.24, Lb = 1051.45 ± 0.15 erg/s). The orange dot-dashed line is the luminosity function obtained by S12 in the case of pure luminosity evolution.
Current usage metrics show cumulative count of Article Views (full-text article views including HTML views, PDF and ePub downloads, according to the available data) and Abstracts Views on Vision4Press platform.
Data correspond to usage on the plateform after 2015. The current usage metrics is available 48-96 hours after online publication and is updated daily on week days.
Initial download of the metrics may take a while.