Fig. 9
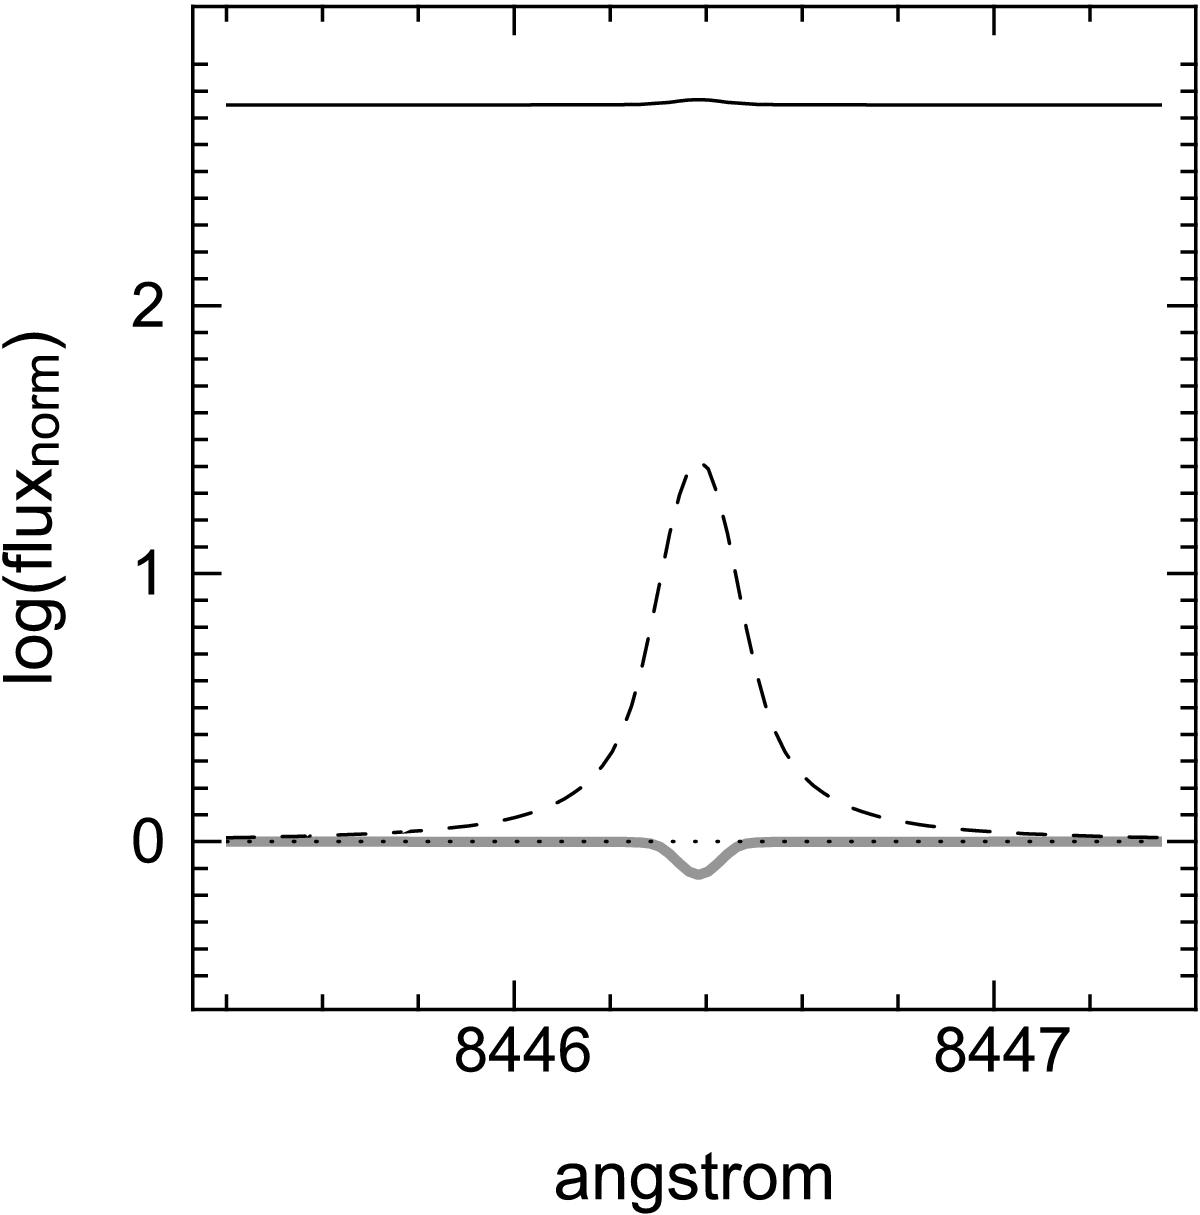
Emerging (synthetic) fluxes obtained when opacities of the continuum and the line are accounted separately. The gray solid line is the synthetic spectrum of the line Fe i at 8446.388 Å, i.e. the emerging flux when the line and continuum opacities are accounted for. The black solid line represents the emerging flux when the emissions alone are accounted for. The dotted line is the level of the continuum when the continuum opacity alone is accounted for. The dashed line is the level of the continuum across the line when both line and continuum opacities are accounted for. The y-axis is expressed as logarithm (base 10) of the normalized flux.
Current usage metrics show cumulative count of Article Views (full-text article views including HTML views, PDF and ePub downloads, according to the available data) and Abstracts Views on Vision4Press platform.
Data correspond to usage on the plateform after 2015. The current usage metrics is available 48-96 hours after online publication and is updated daily on week days.
Initial download of the metrics may take a while.