Fig. 8
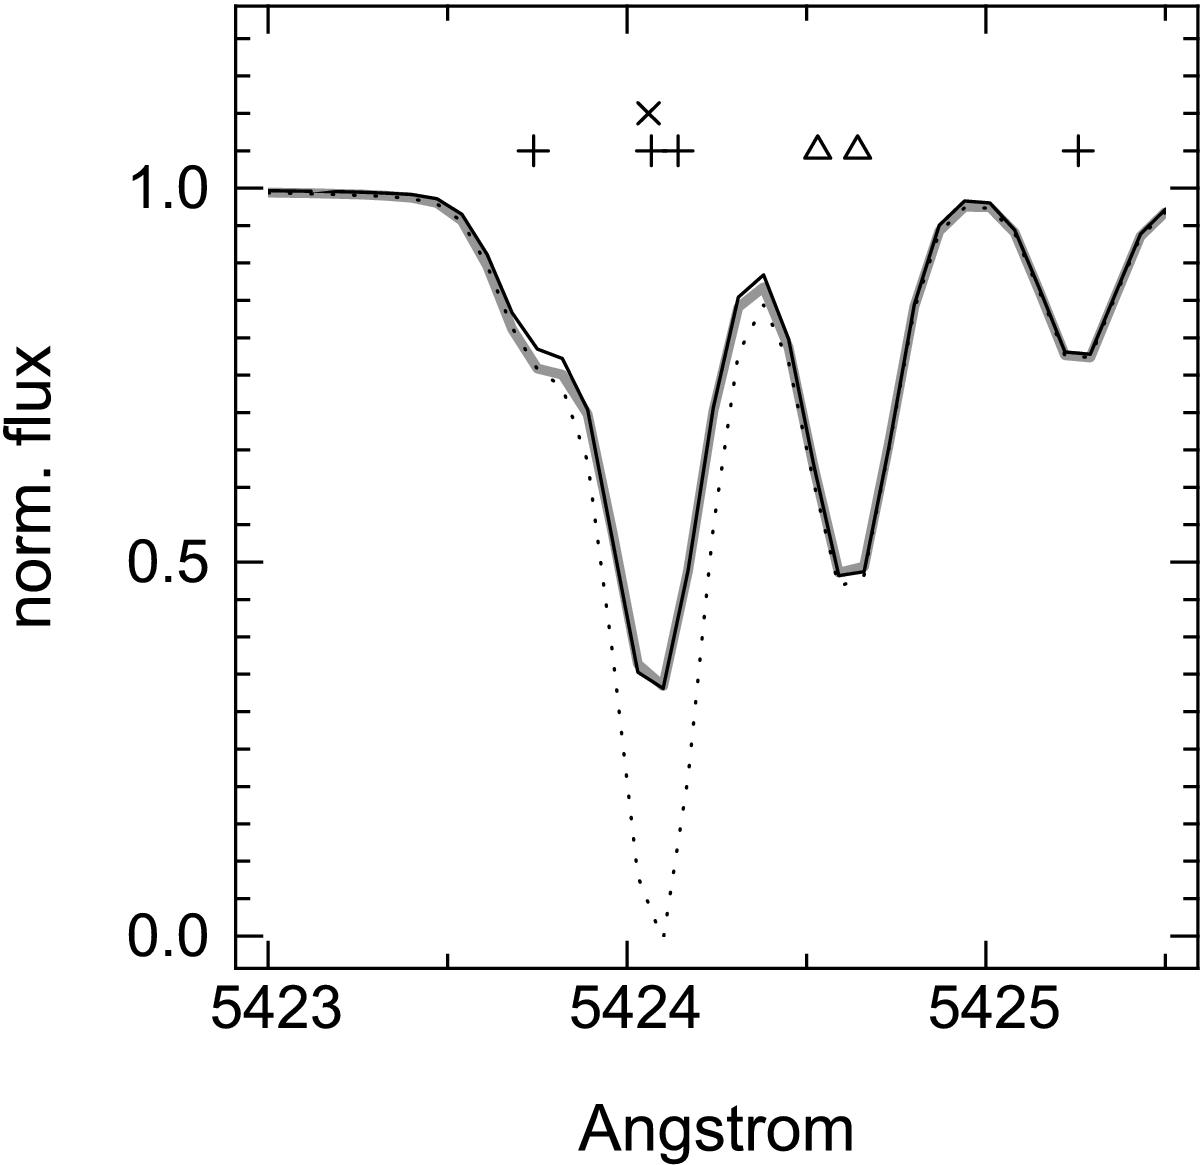
Comparison between the synthetic spectrum with stellar parameters Teff = 4200 K, log g = 1.4, and [M/H] = 0.0 dex (the black solid line) and the corrispondent spectrum model (the gray solid line) constructed by SP_Ace using the EWs corrected for the opacity of the neighbor lines as described in Sect. 5.3. The dotted line is the spectrum model constructed using the EW of the lines computed as if they were isolated (i.e., no correction for the opacity of the neighbor lines). Plus, cross, and triangle symbols indicate the position of the Fe , V , and Ni lines, respectively.
Current usage metrics show cumulative count of Article Views (full-text article views including HTML views, PDF and ePub downloads, according to the available data) and Abstracts Views on Vision4Press platform.
Data correspond to usage on the plateform after 2015. The current usage metrics is available 48-96 hours after online publication and is updated daily on week days.
Initial download of the metrics may take a while.