Fig. 6
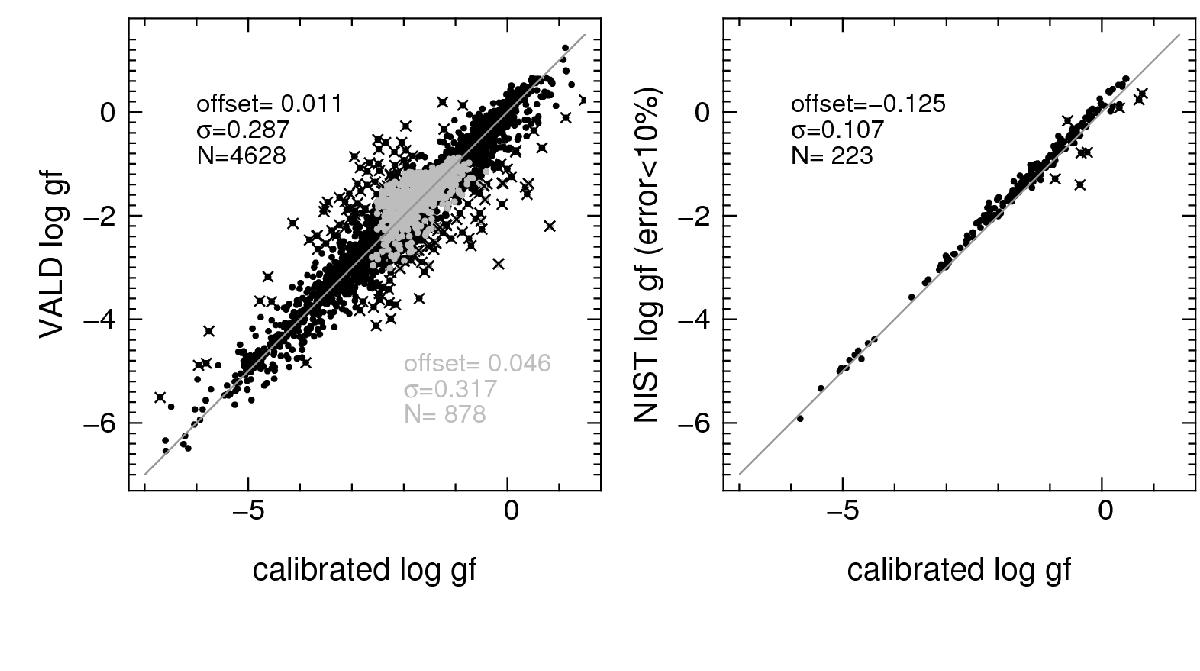
Right: comparison between the VALD and our calibrated log gfs. Black and gray points represent atomic and molecular CN lines, respectively. Left: comparison between the NIST and our log gfs values for those lines with NIST log gf precision better than 10%. Only lines having EW> 5 mÅ in the solar spectrum are reported here. The offsets and standard deviations are computed as “calibrated minus reference” after rejecting the outliers (crossed points) with a 3σ clipping.
Current usage metrics show cumulative count of Article Views (full-text article views including HTML views, PDF and ePub downloads, according to the available data) and Abstracts Views on Vision4Press platform.
Data correspond to usage on the plateform after 2015. The current usage metrics is available 48-96 hours after online publication and is updated daily on week days.
Initial download of the metrics may take a while.